

When to use
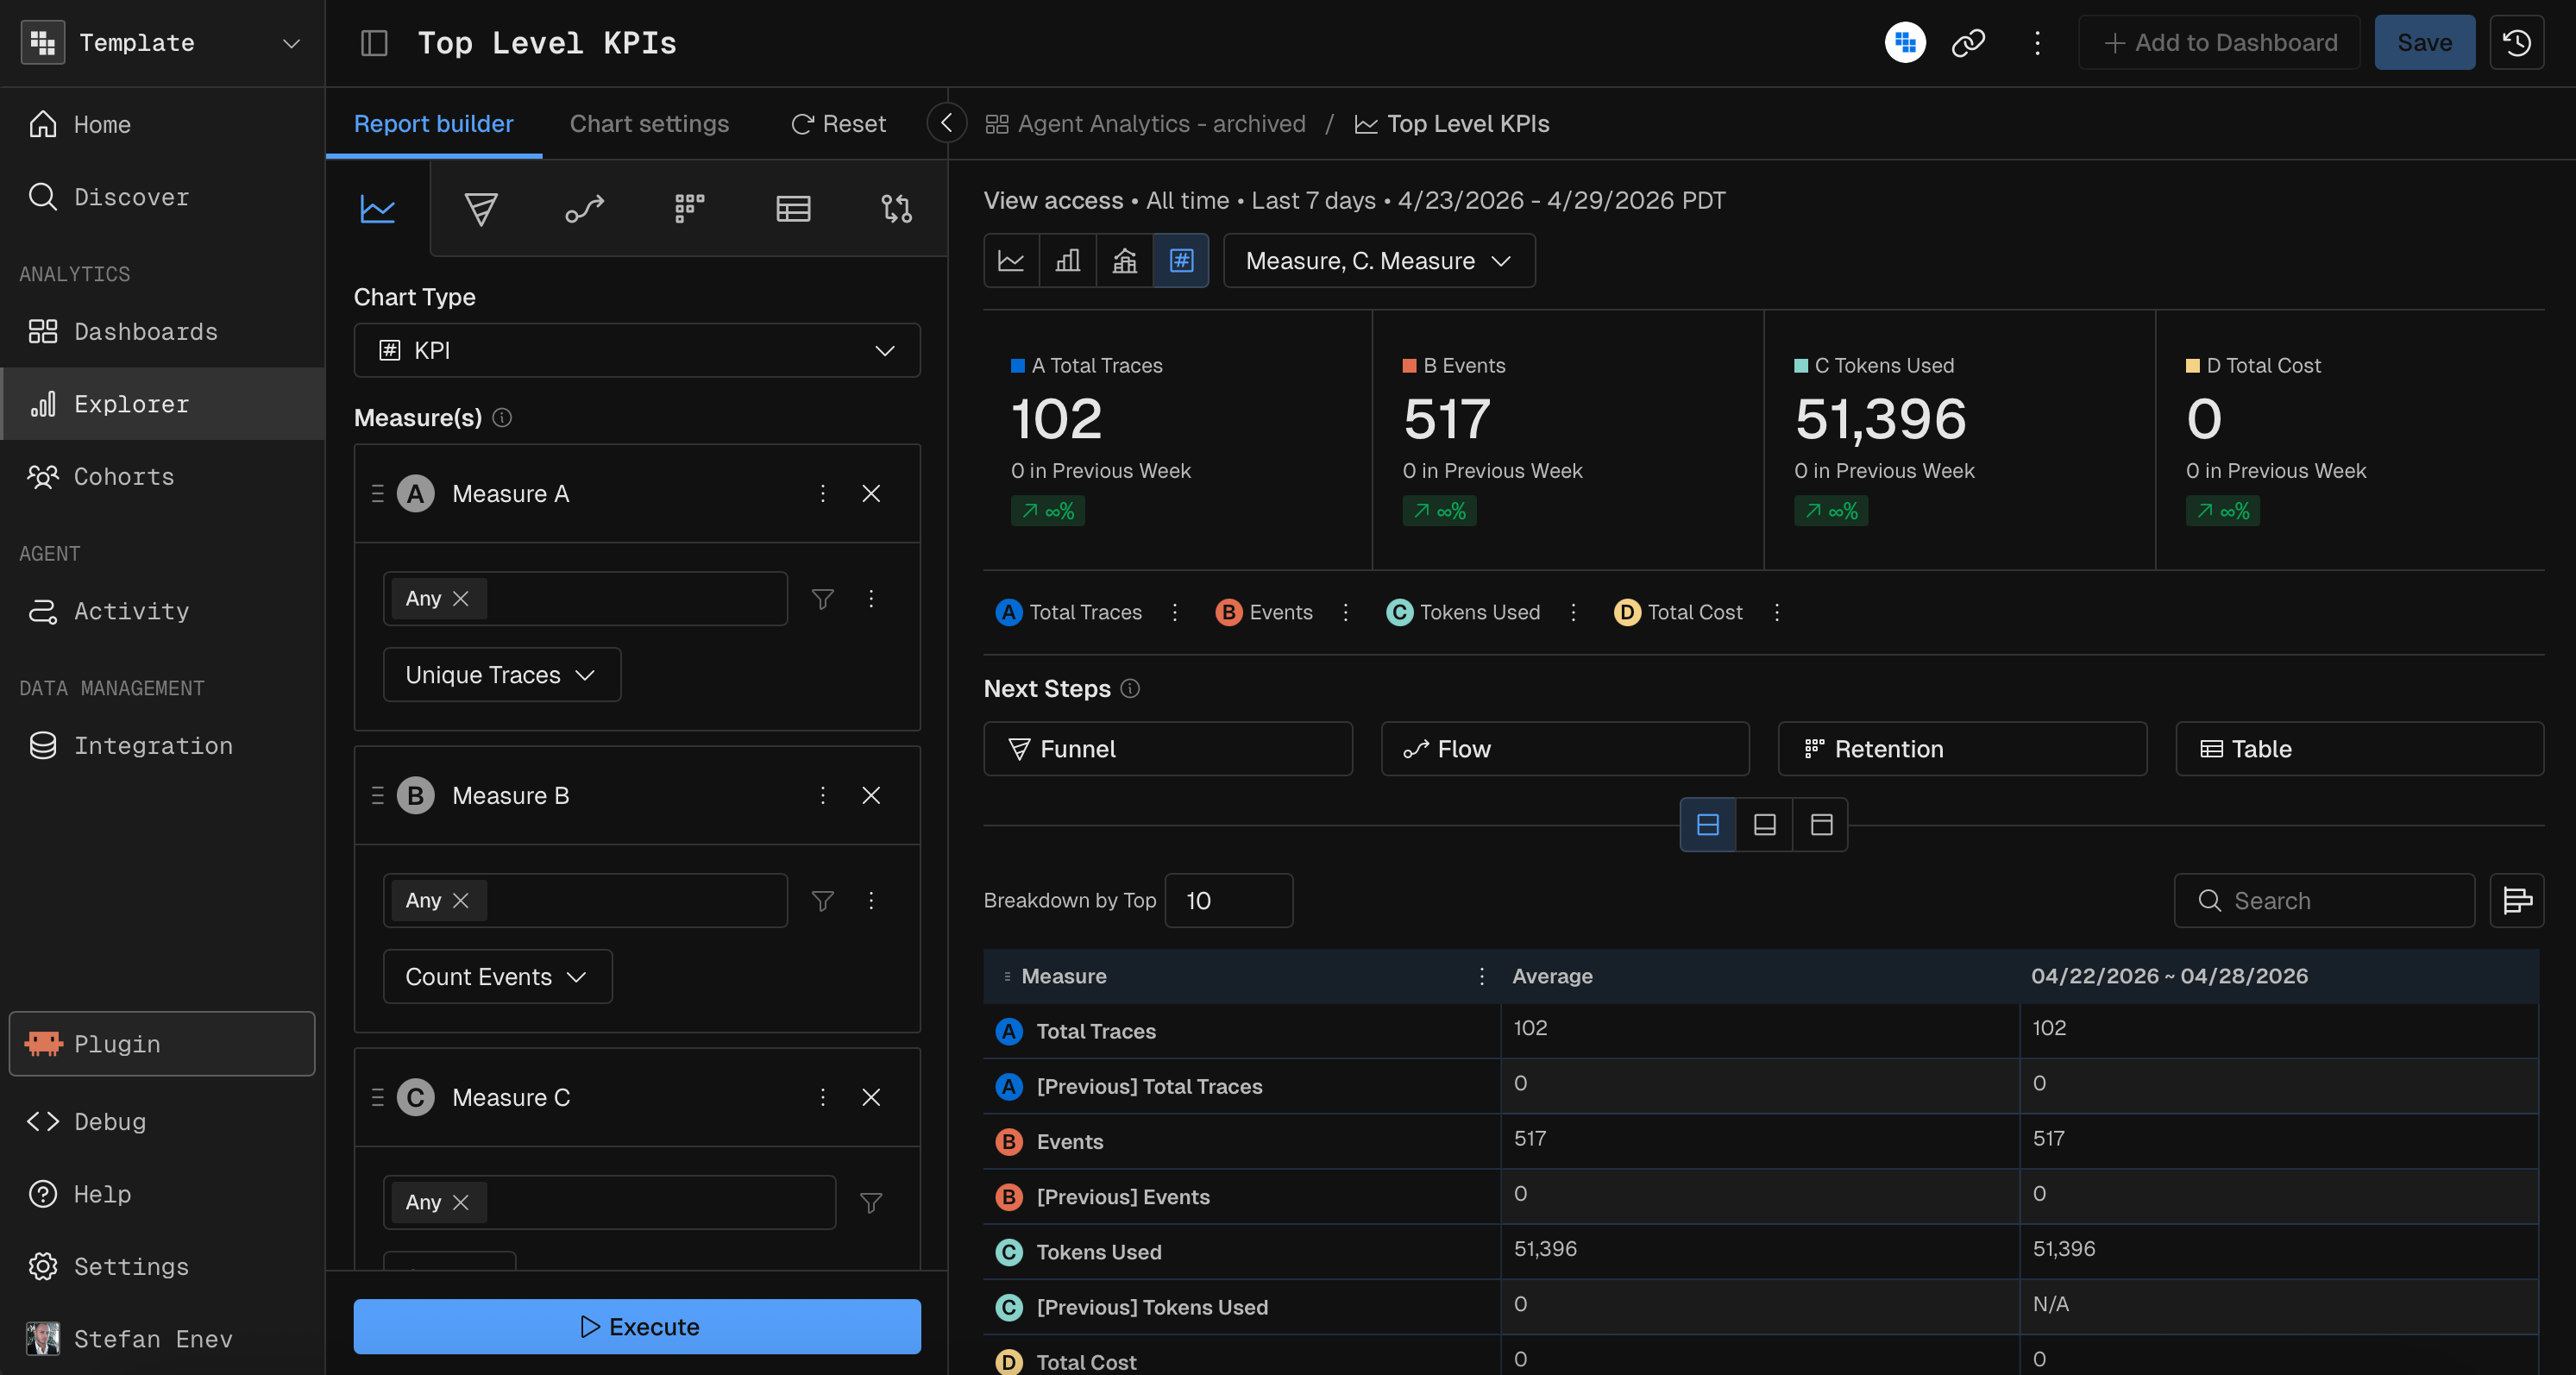
Build your measures
A measure has three parts: the event to analyze, the function to compute, and any filters to apply.Event
Select the events to analyze from the event dropdown in the measure. Selecting several events in one measure uses OR logic: a member of the measure performed Event 1 or Event 2. To apply different filters to different events, add another event group to the same measure. Open the event group’s options menu (the three-dot icon) and click Add Event, which adds events to the measure with OR logic. Duplicate Event copies the group.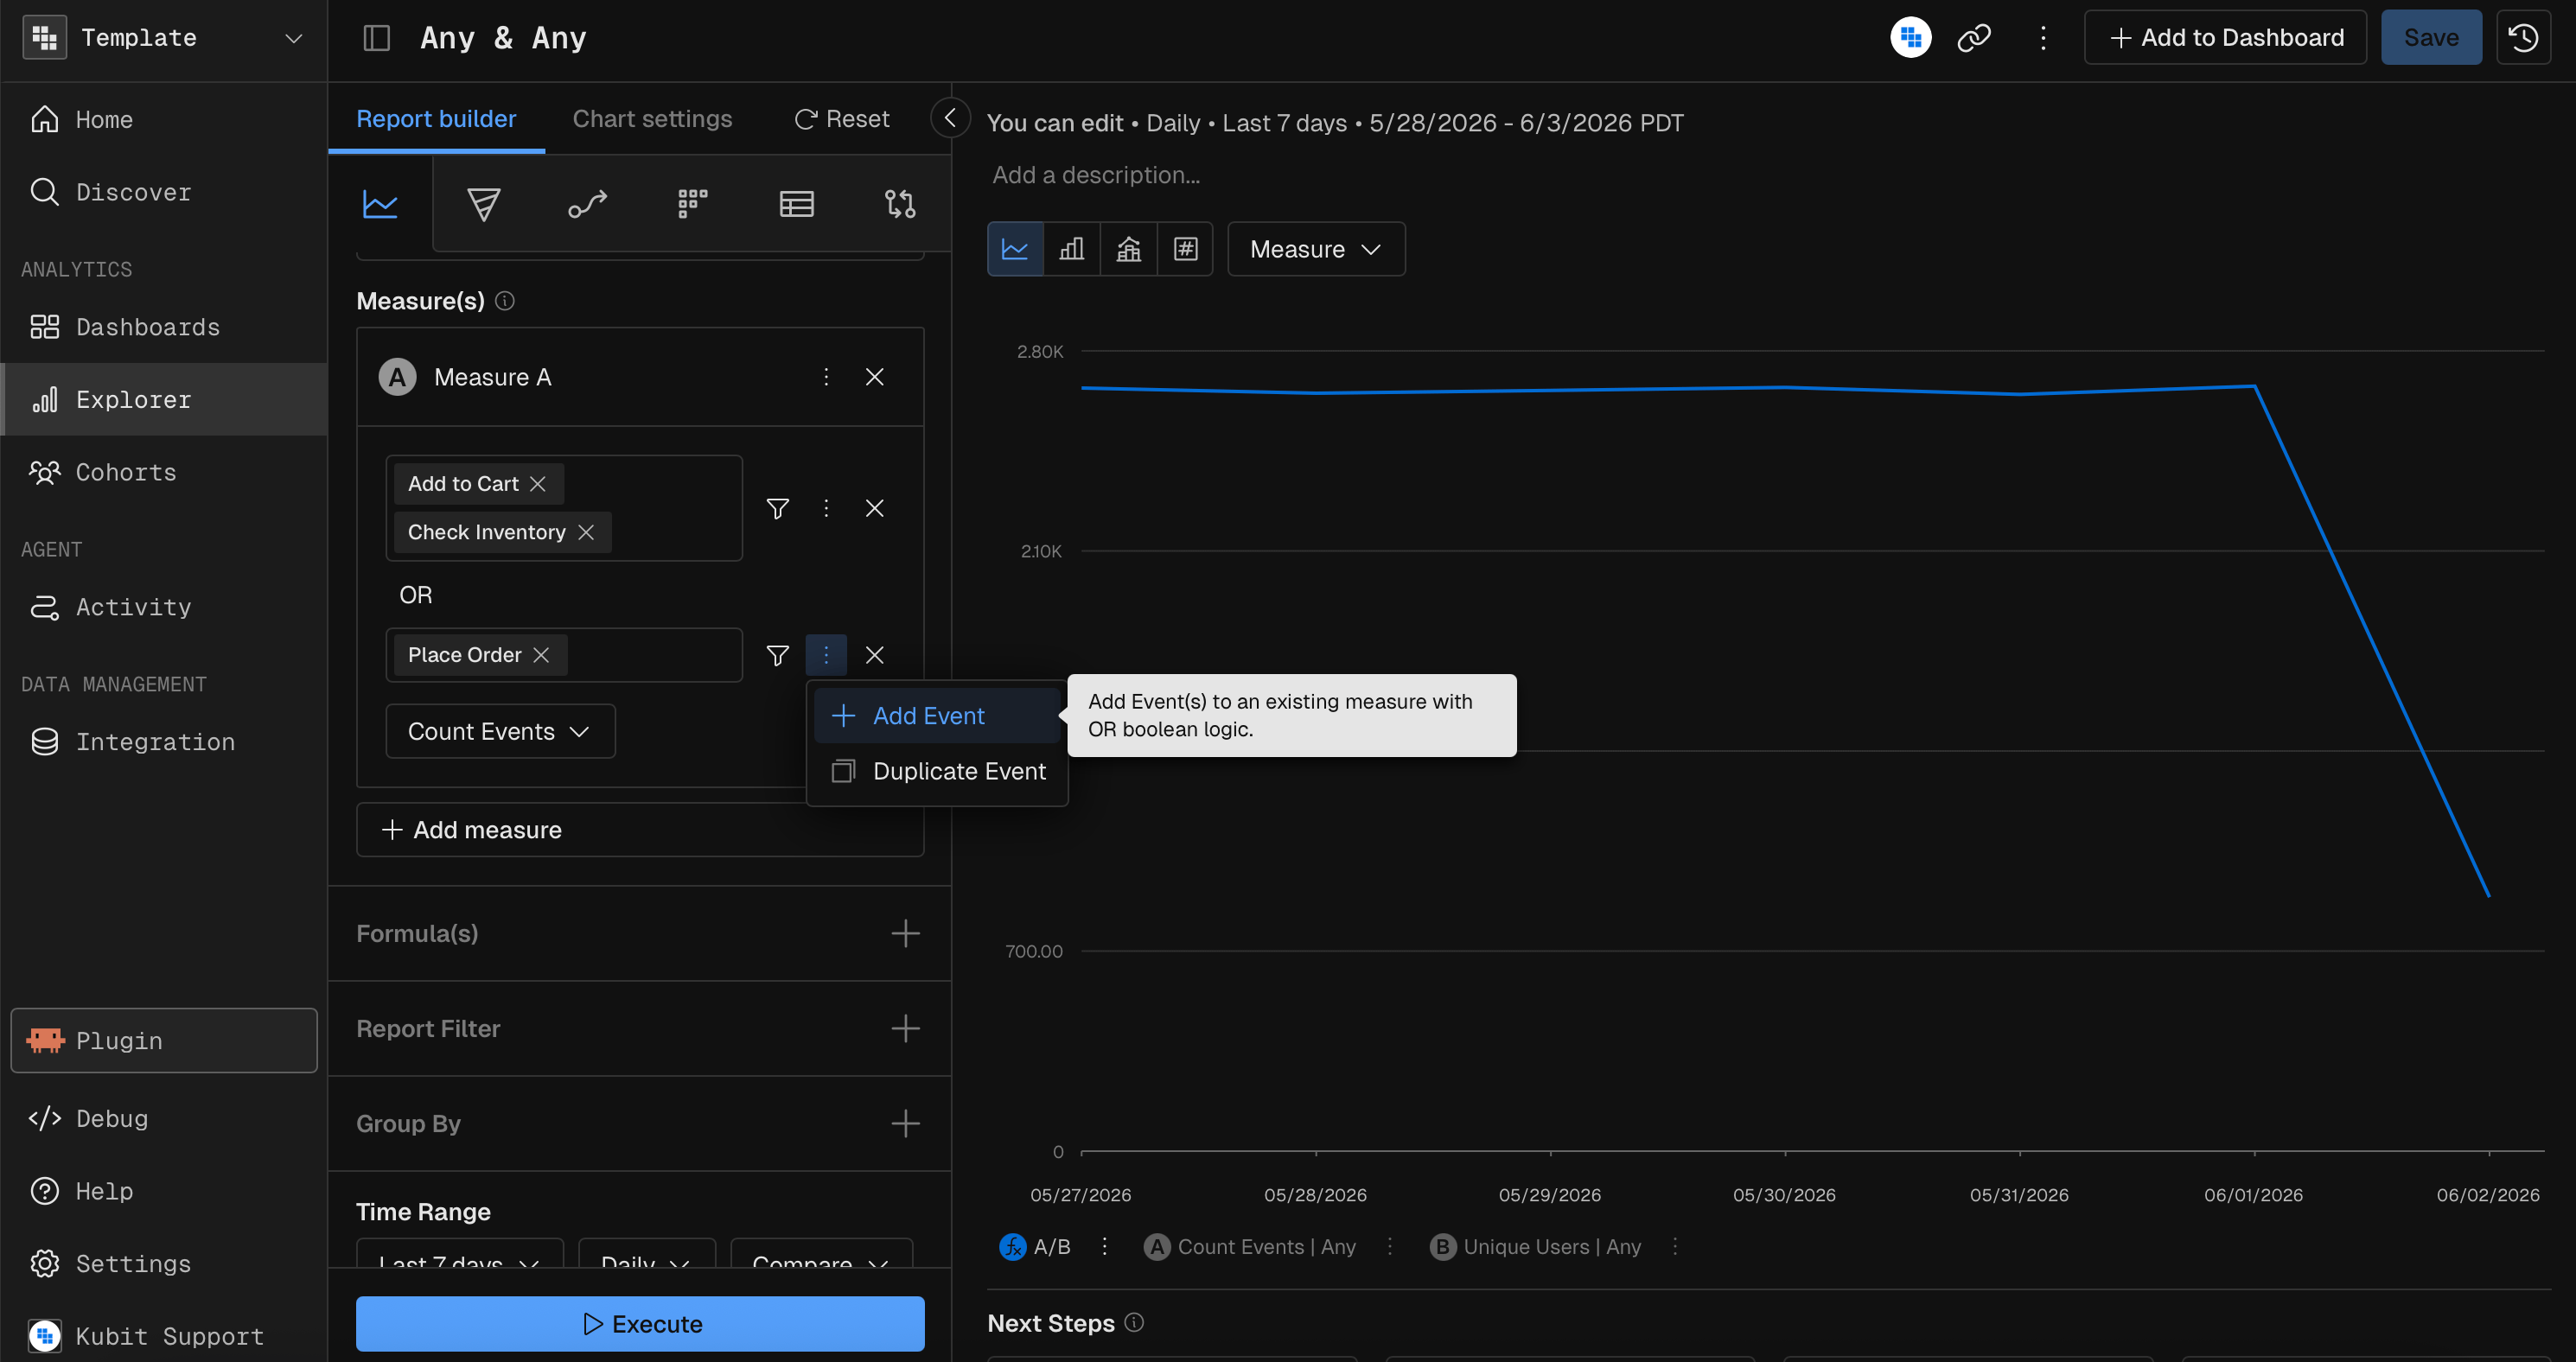
Measure functions
The measure function sets what Kubit computes for the selected events.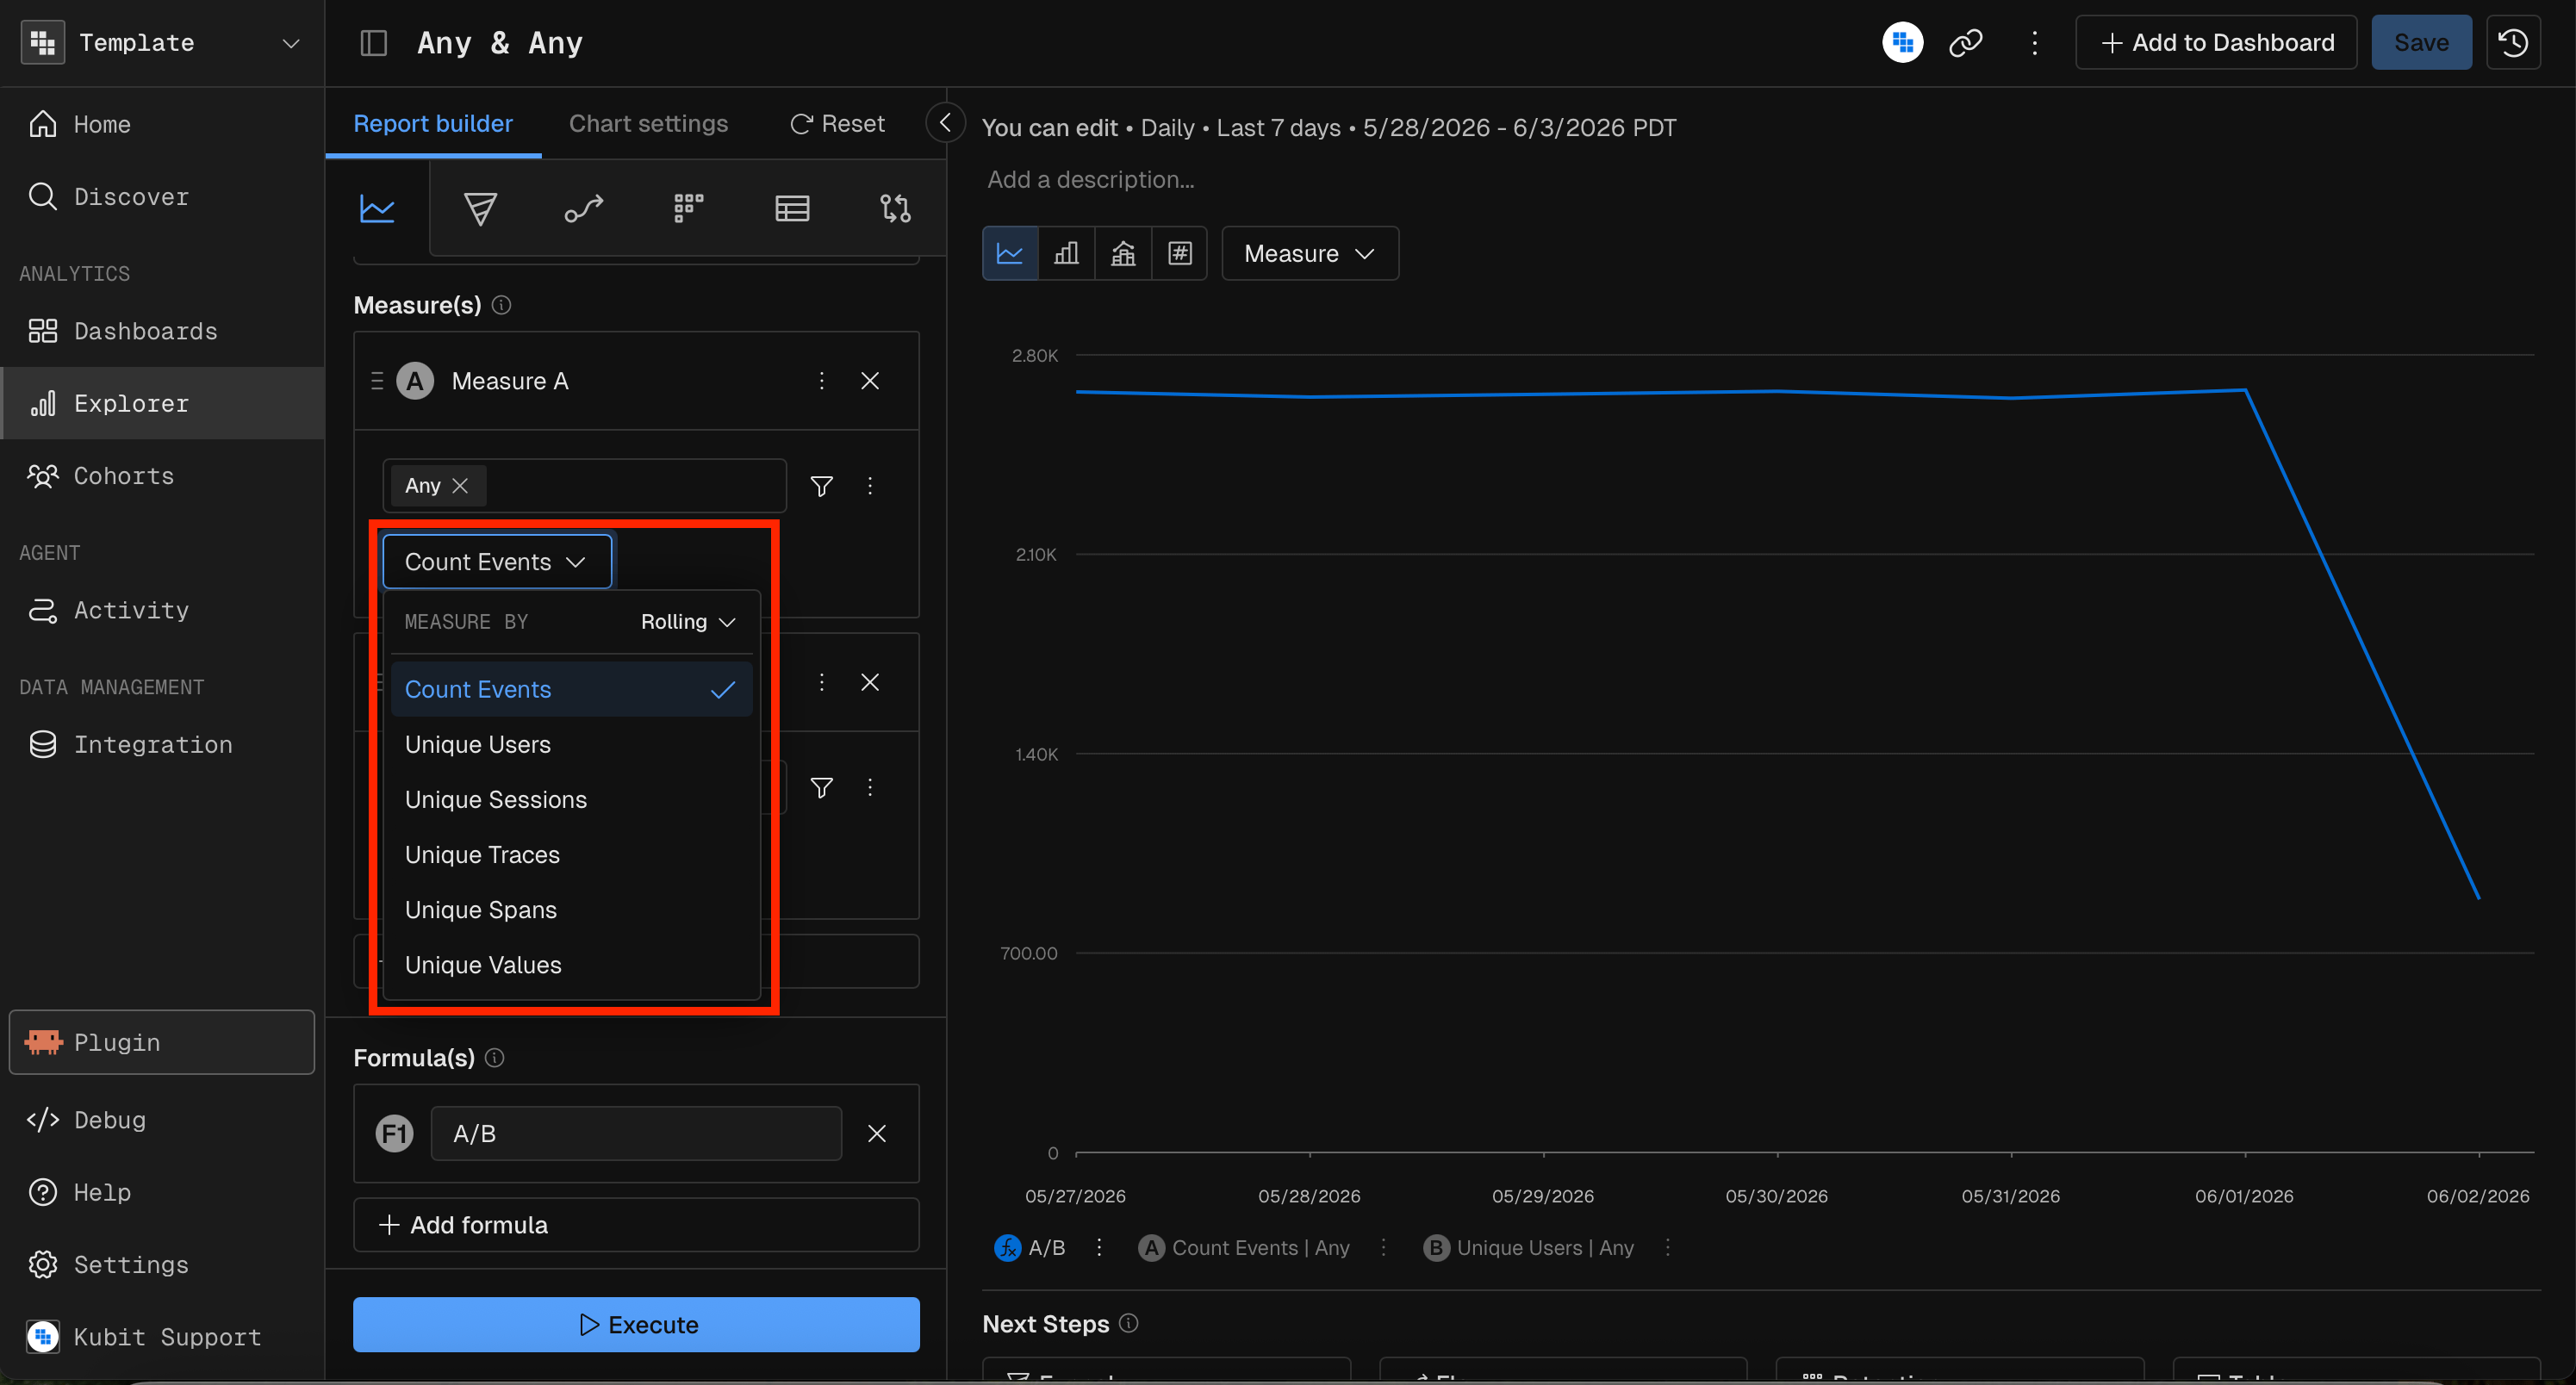
Prompt Kubit through MCP
With the Kubit MCP server connected to Claude, ChatGPT or another AI tool, you create Query reports by describing them in plain language. The MCP server turns the request into a chart configuration.What a good prompt includes
MCP prompt examples
Simple, with one measure and no breakdown:“Show me a KPI of total events this week”Medium, with a measure, a breakdown and a time range:
“Create a bar chart of daily count distinct users over the last 14 days, broken down by country”Advanced, with several measures, a filter and a comparison:
“Build a combo chart showing weekly total revenue as bars and average order value as a line for the last 3 months, filtered to premium users, compared to the previous 3 months”Chart-specific parameters:
“Create a heatmap of average response time with model name on the X-axis and tool name on the Y-axis for the last 7 days”
How Kubit reads a prompt
Query reference
Related
- Reports overview: the other report types.
- Dashboards: put a Query report on a dashboard.