

When to use
How cohorts work
A cohort is evaluated every time it’s used. It isn’t a static list of members. Kubit recalculates which subjects match the conditions each time a report applies the cohort, using current data and that report’s date range. Saved cohorts are named entries in the Cohort Dictionary, so you can reuse them across reports without rebuilding the conditions.Cohort types
A simple cohort has one of five types. Each type decides membership from a different source. You pick the type in the dropdown after who in the cohort builder.
The dropdown also has Are part of Cohort, which builds a cohort from another saved cohort.
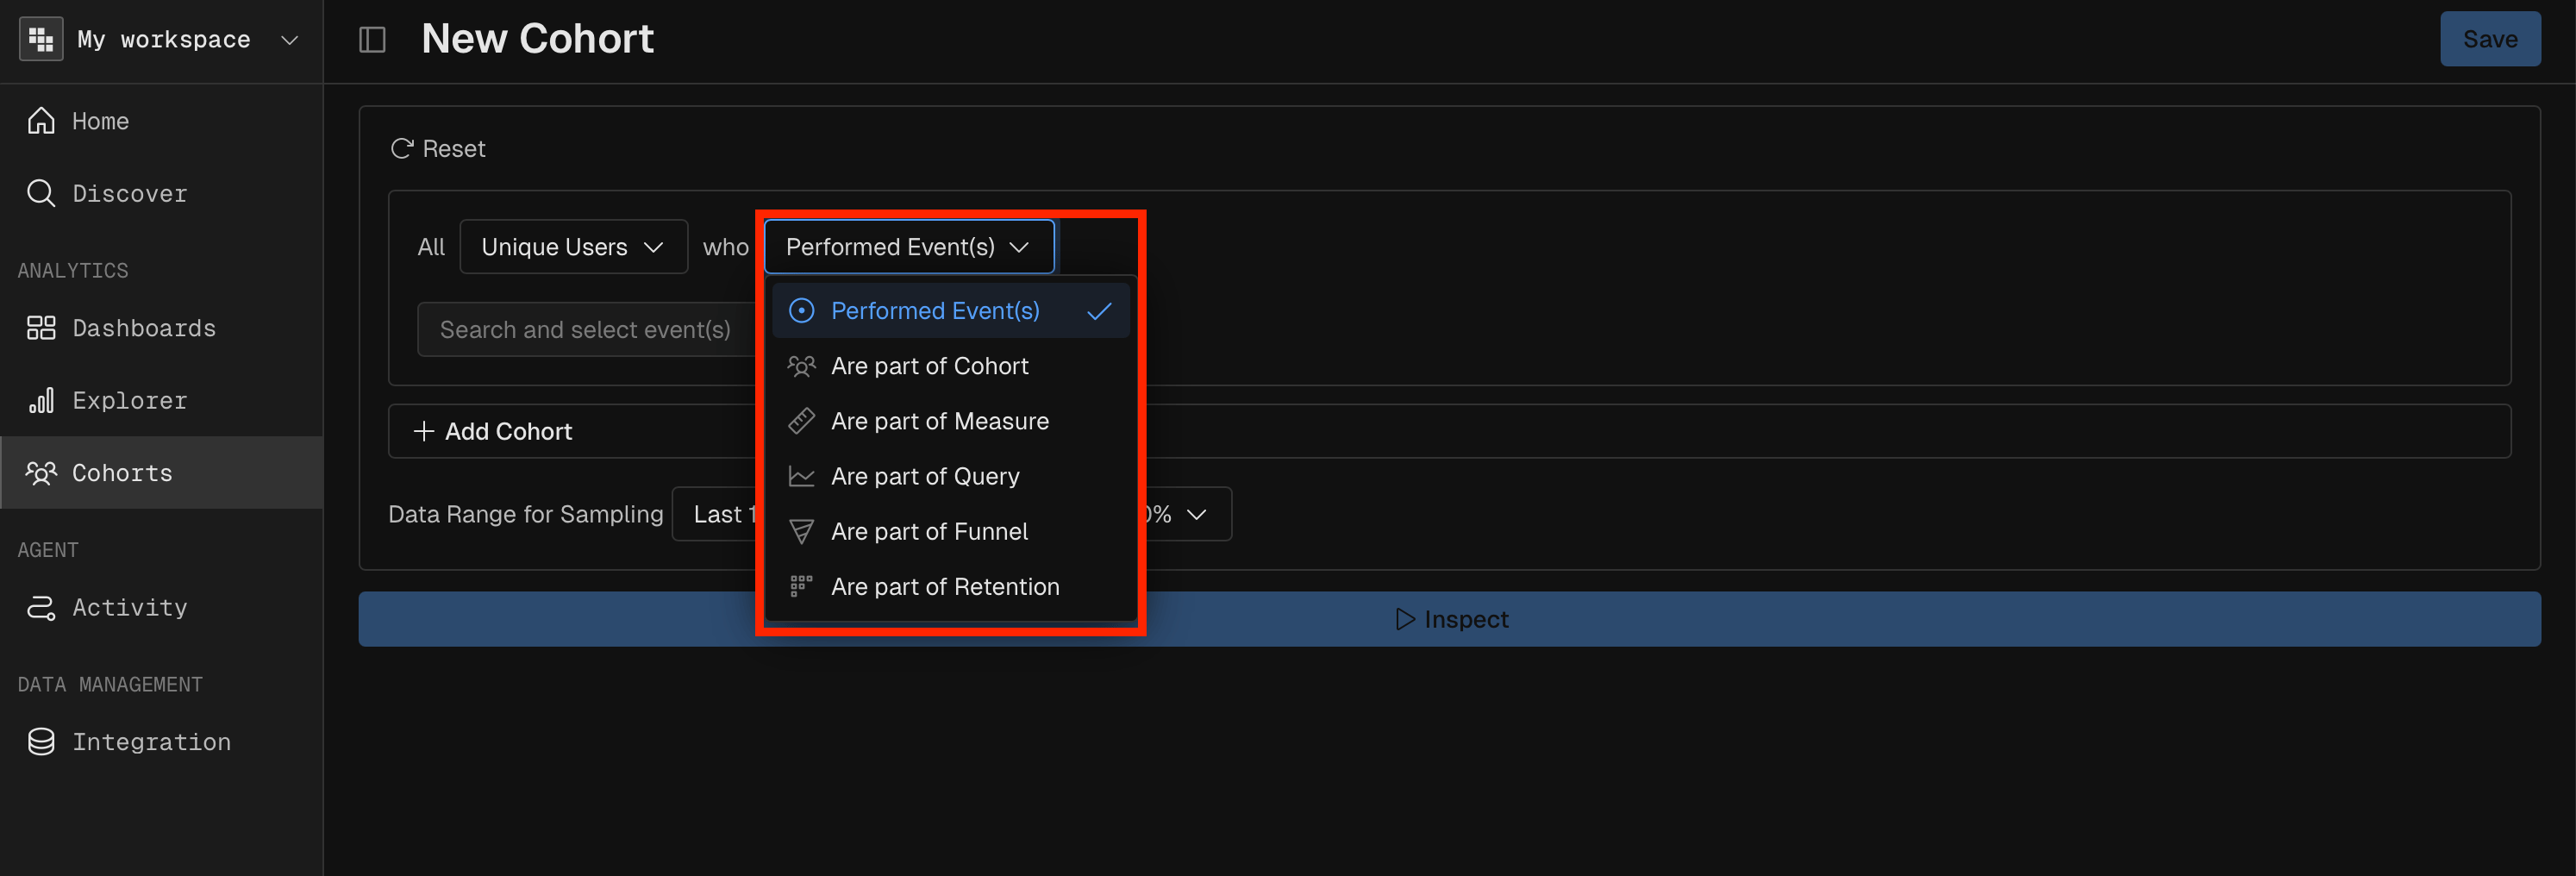
Performed
A Performed cohort selects subjects by whether, and how many times, they performed specific events.
Operators: is true (performed at all), is false (never performed), equals, not equals, less than, greater than, less or equal, greater or equal and between.
Example: users who performed
tool call more than 5 times.
Measure
A Measure cohort selects subjects by whether a measure value meets a condition.
Operators: equals, not equals, less than, greater than, less or equal, greater or equal and between.
Example: users whose total token count is greater than 10,000.
Expression
An Expression cohort selects subjects by a measure from a saved Query report.
Example: users whose average latency, from the “Performance Overview” report, is above the 95th percentile.
Funnel
A Funnel cohort selects subjects by their behavior in a saved Funnel report.
Operators: converted on (step N), dropped off before (step N) and dropped off since (step N).
Example: users who dropped off before step 3 of the checkout funnel.
Retention
A Retention cohort selects subjects by their behavior in a saved Retention report.
Operators: retained, retained on (period N), retained since (period N), retained between (N and M), not retained, not retained on, not retained since and returned.
Example: users retained on Day 7 of the onboarding retention report.
Time windows
A cohort’s time window sets when a subject has to meet the cohort’s conditions to count. Pick it in the dropdown next to the condition.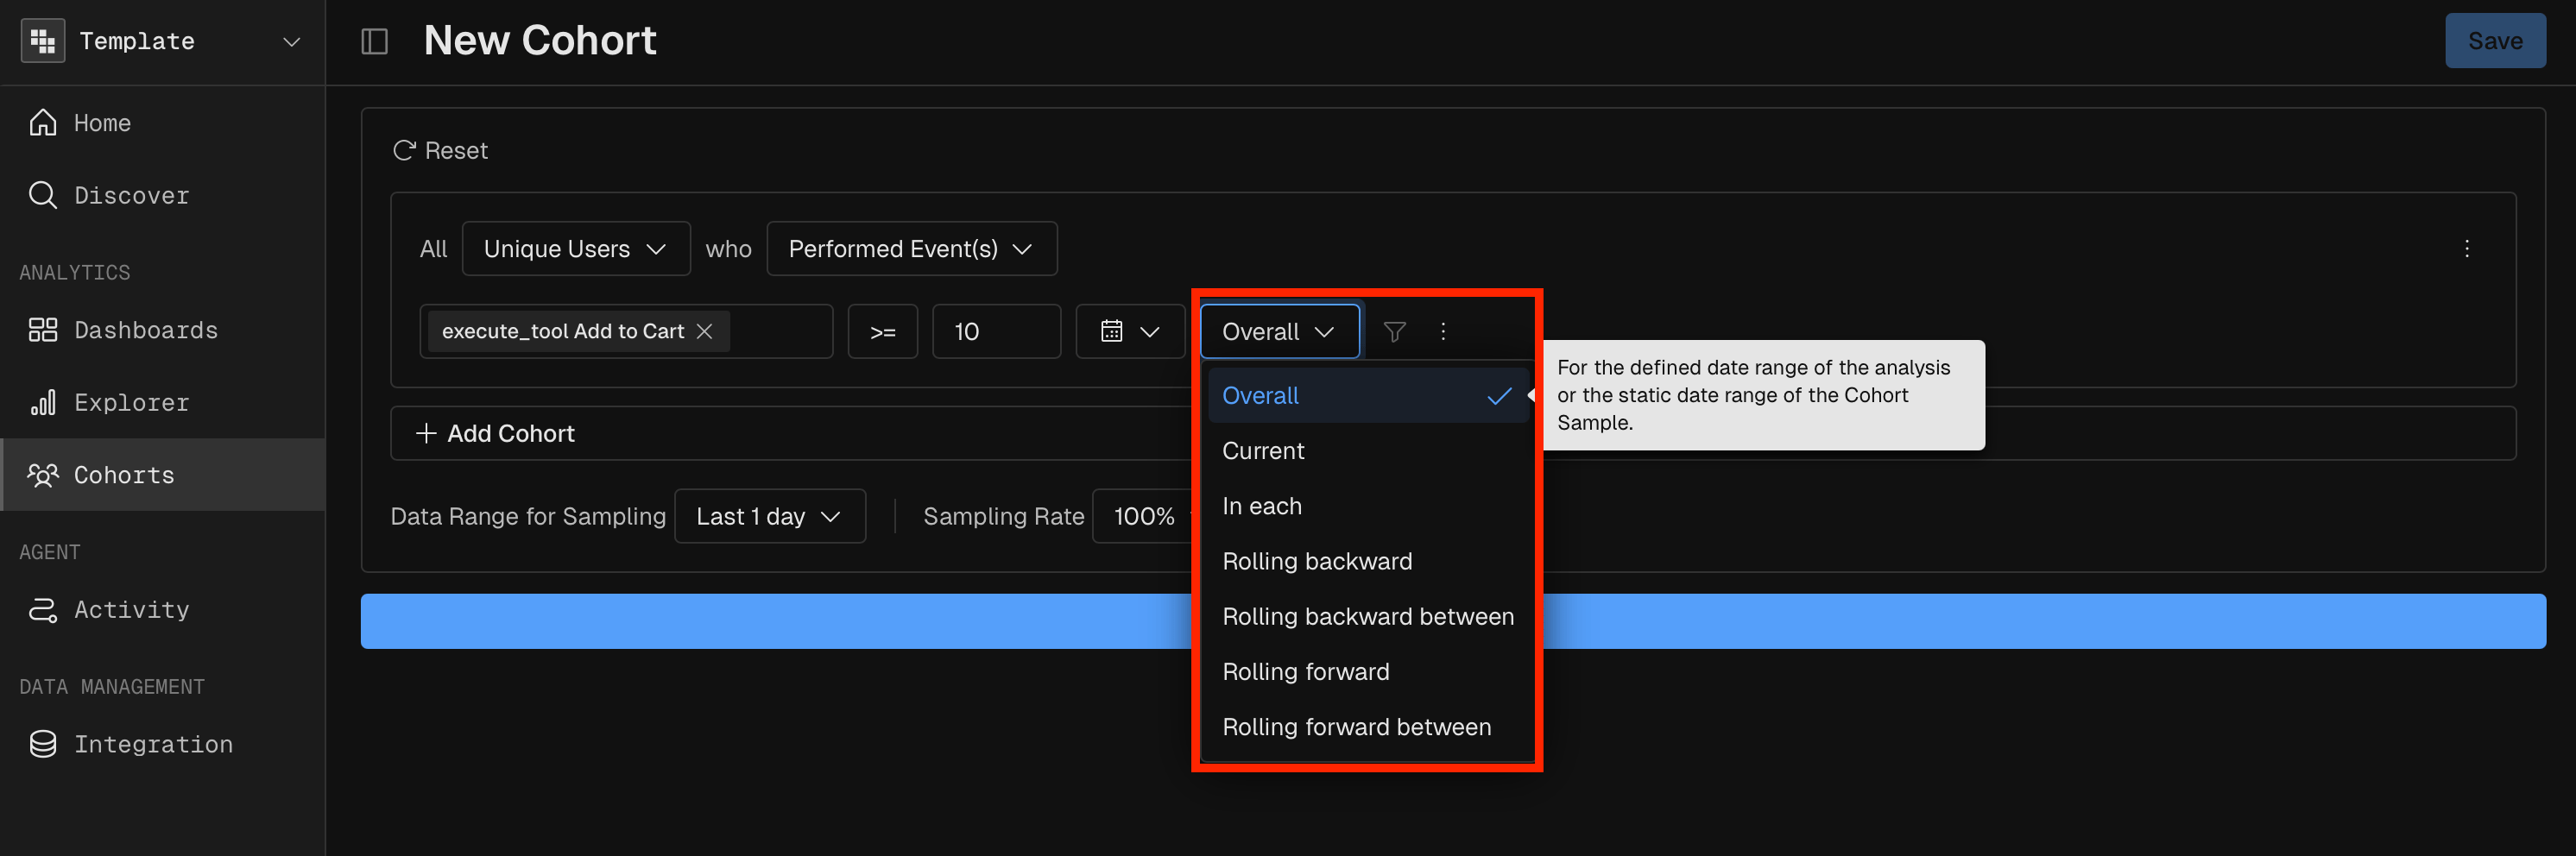
Current and In each
Take a Query report that countsEnable Notifications events over the last 7 days, filtered to a cohort of users who performed Started a Stream.
Current doesn’t check when the subject performed the report’s own events. In each does: both events have to happen in each interval.
Rolling backward
A Rolling backward window of 7 days on a “Power User” cohort works like this:Rolling backward between
A report for Jan 15 counts how many people used your app, filtered to users who renewed their subscription in the last 7 days but not today. The cohort isRenewed Subscription with a Rolling backward between window of 1 and 7 days. Kubit checks Jan 8 (7 days before) to Jan 14 (1 day before). A user who renewed in that window is in the Jan 15 result.
Compound cohorts
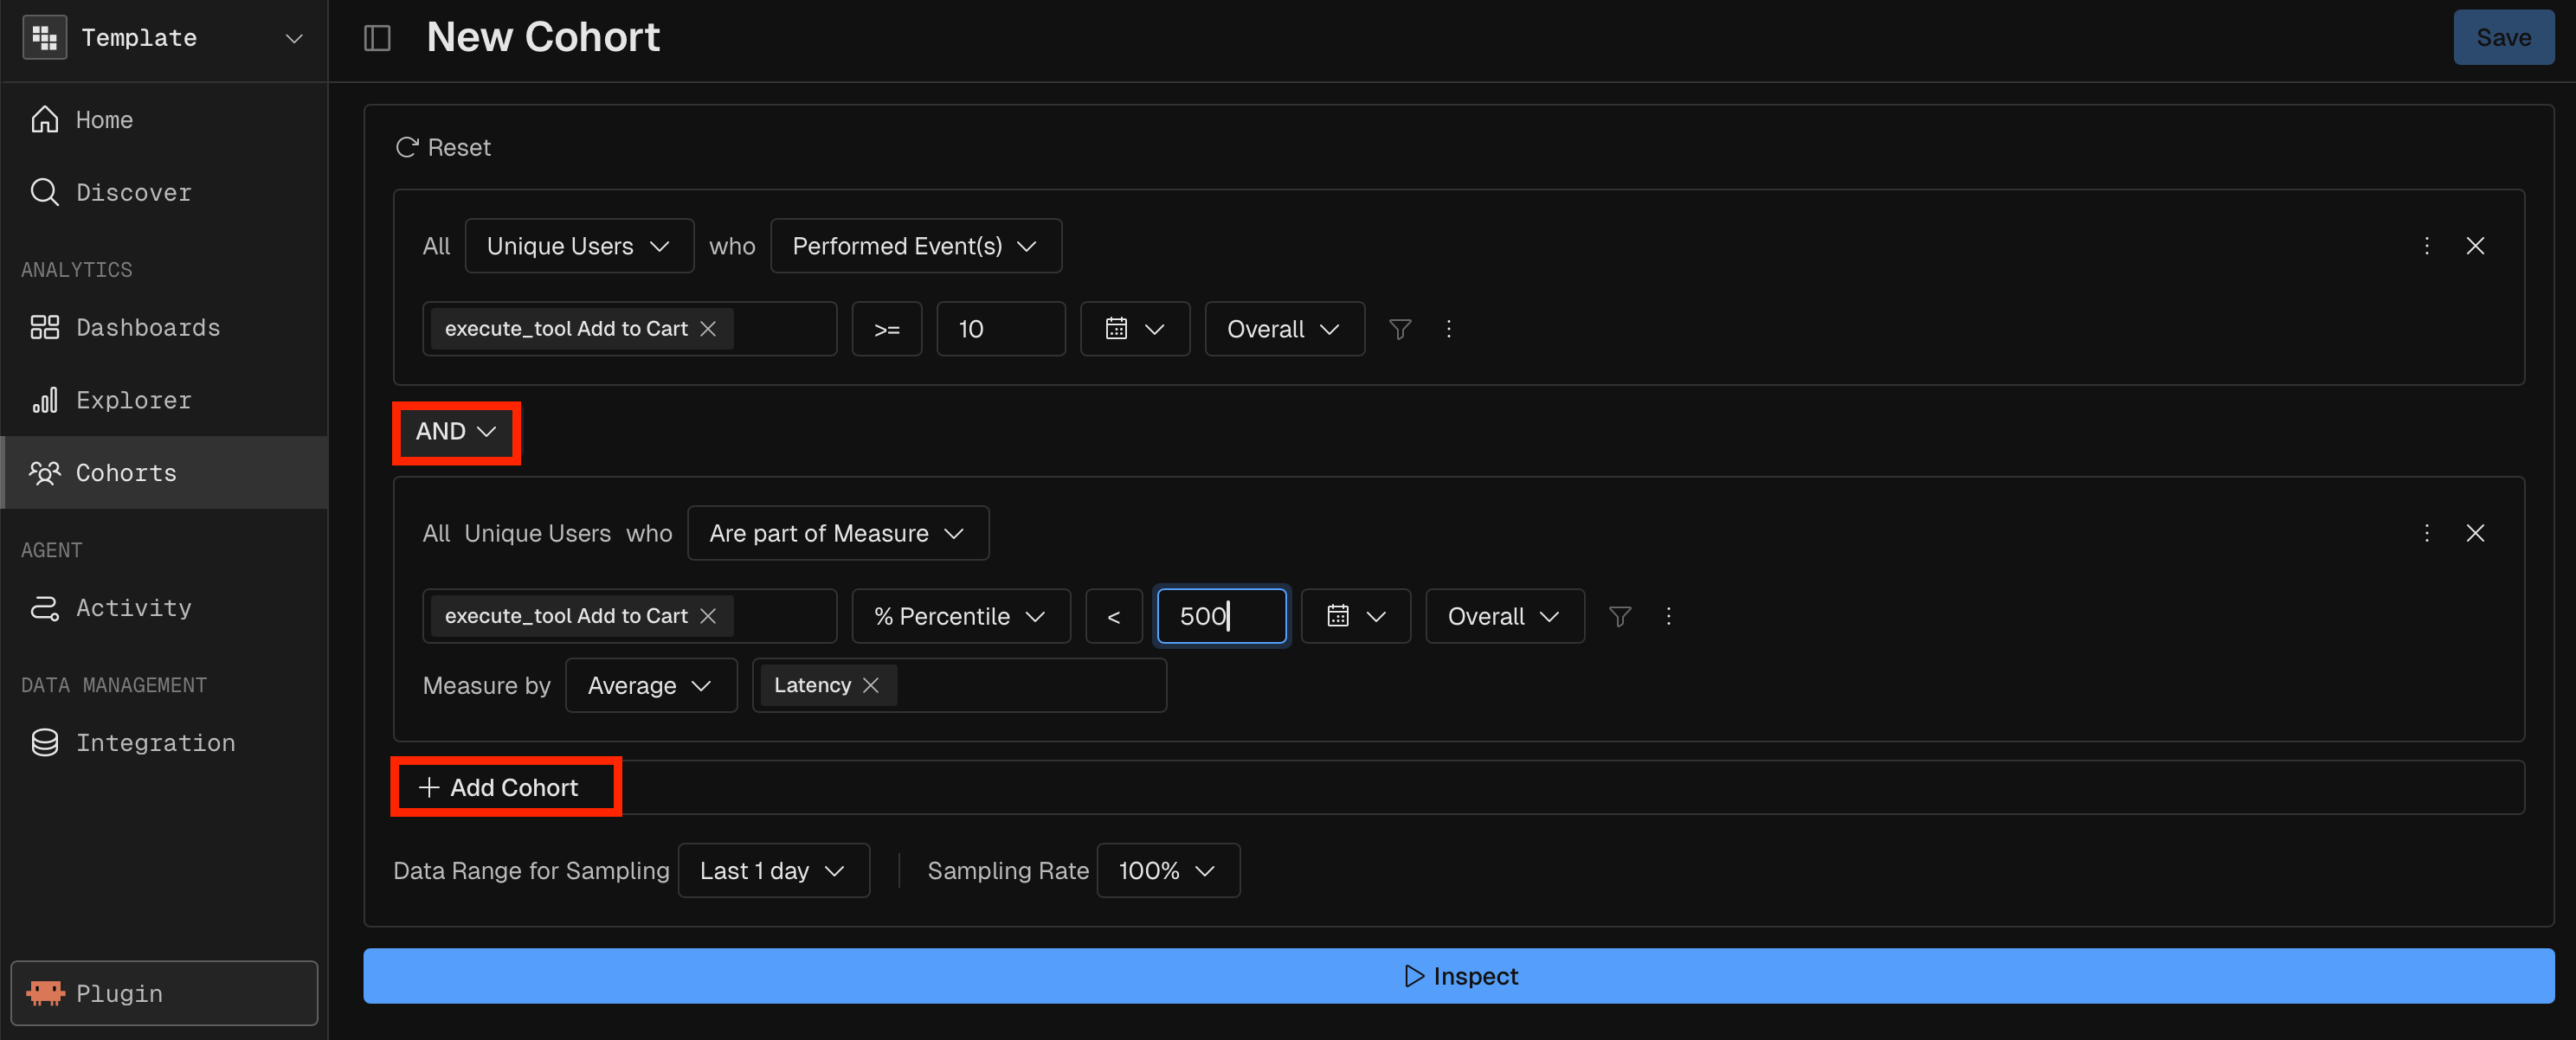
A compound cohort combines simple cohorts with AND or OR. In the cohort builder, click Add Cohort to add another condition, then pick AND or OR between them.
Example: users who performed
tool call more than 5 times AND whose average latency is below 500 ms. This combines a Performed cohort and a Measure cohort with AND.
Manage cohorts
Saved cohorts live in the Cohort Dictionary, which opens from Cohorts in the left nav.Cohort Dictionary
Create a cohort
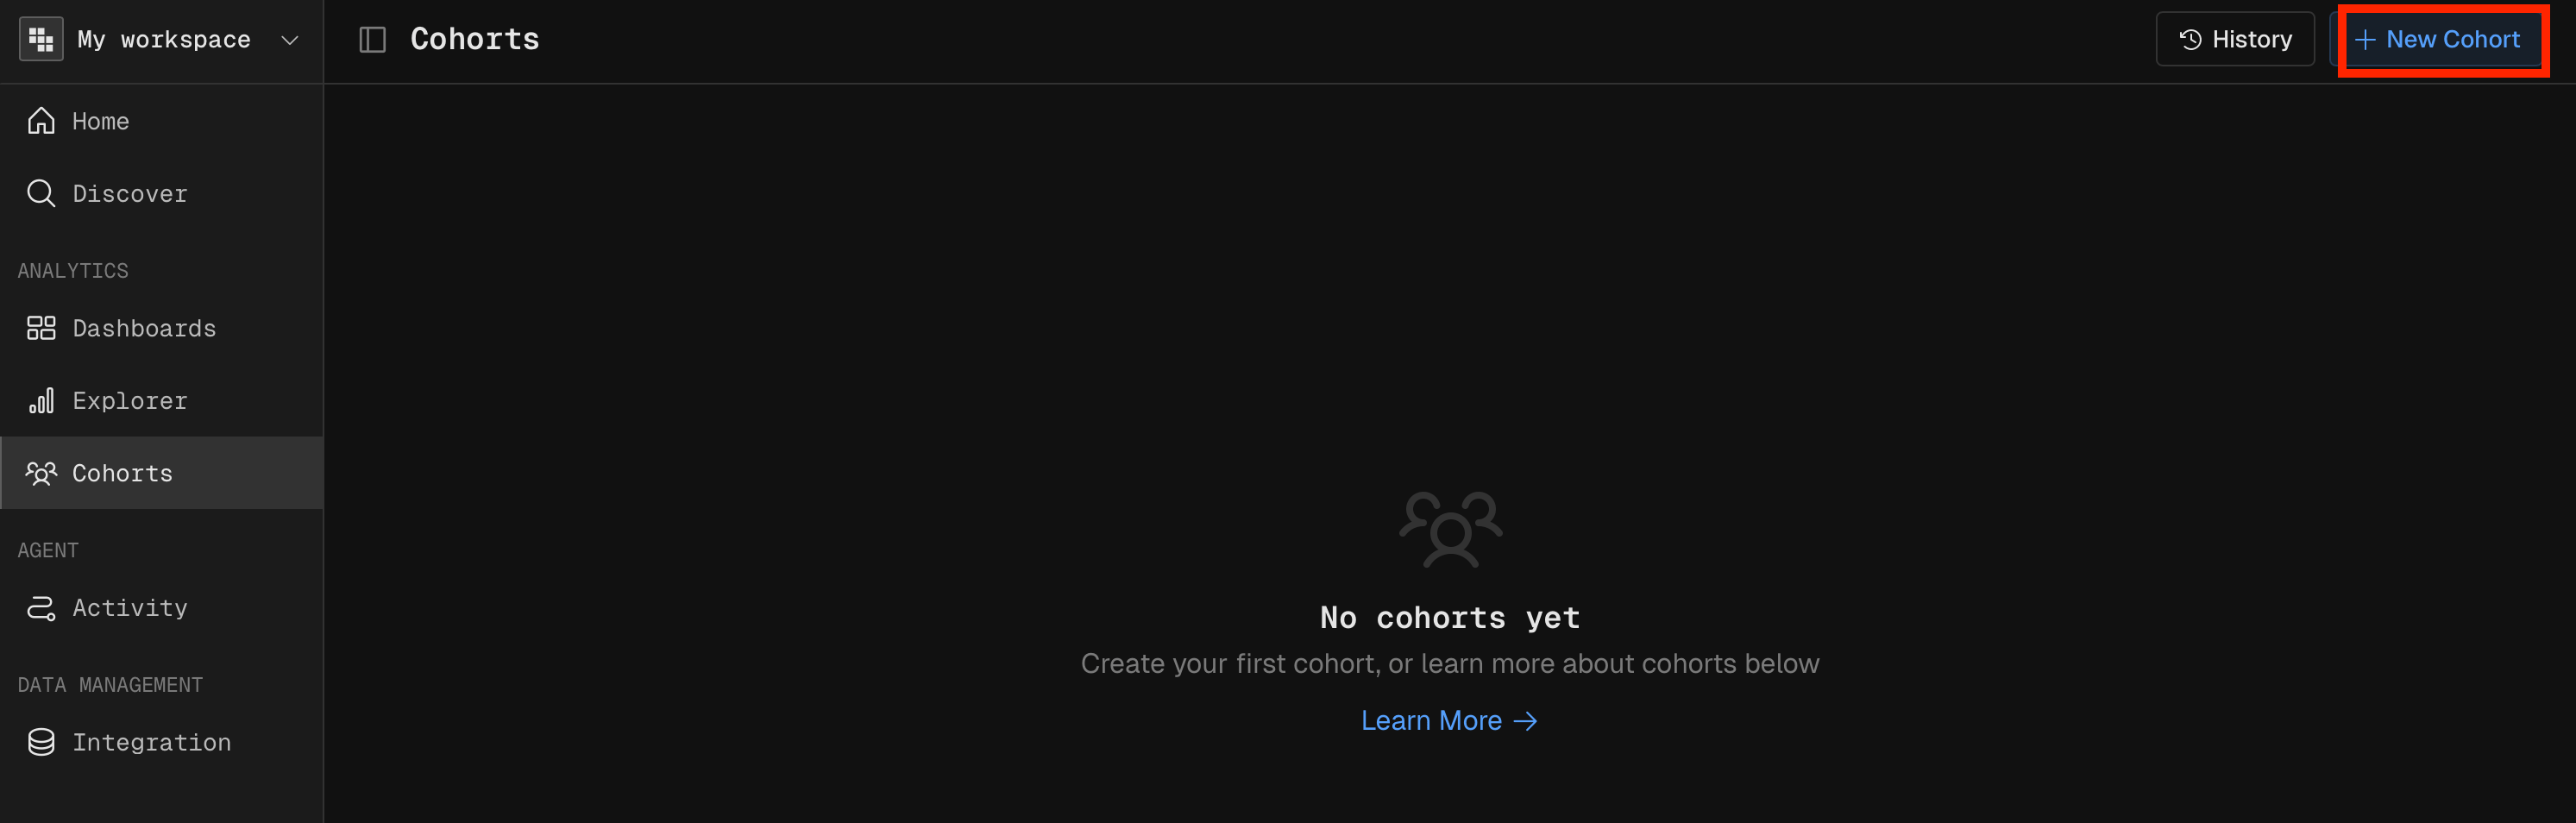
- Open Cohorts and click New Cohort.
- Pick a cohort type and set its conditions.
- Click Inspect to preview the result.
- Click Save, then enter a name and an optional description.
Preview a cohort
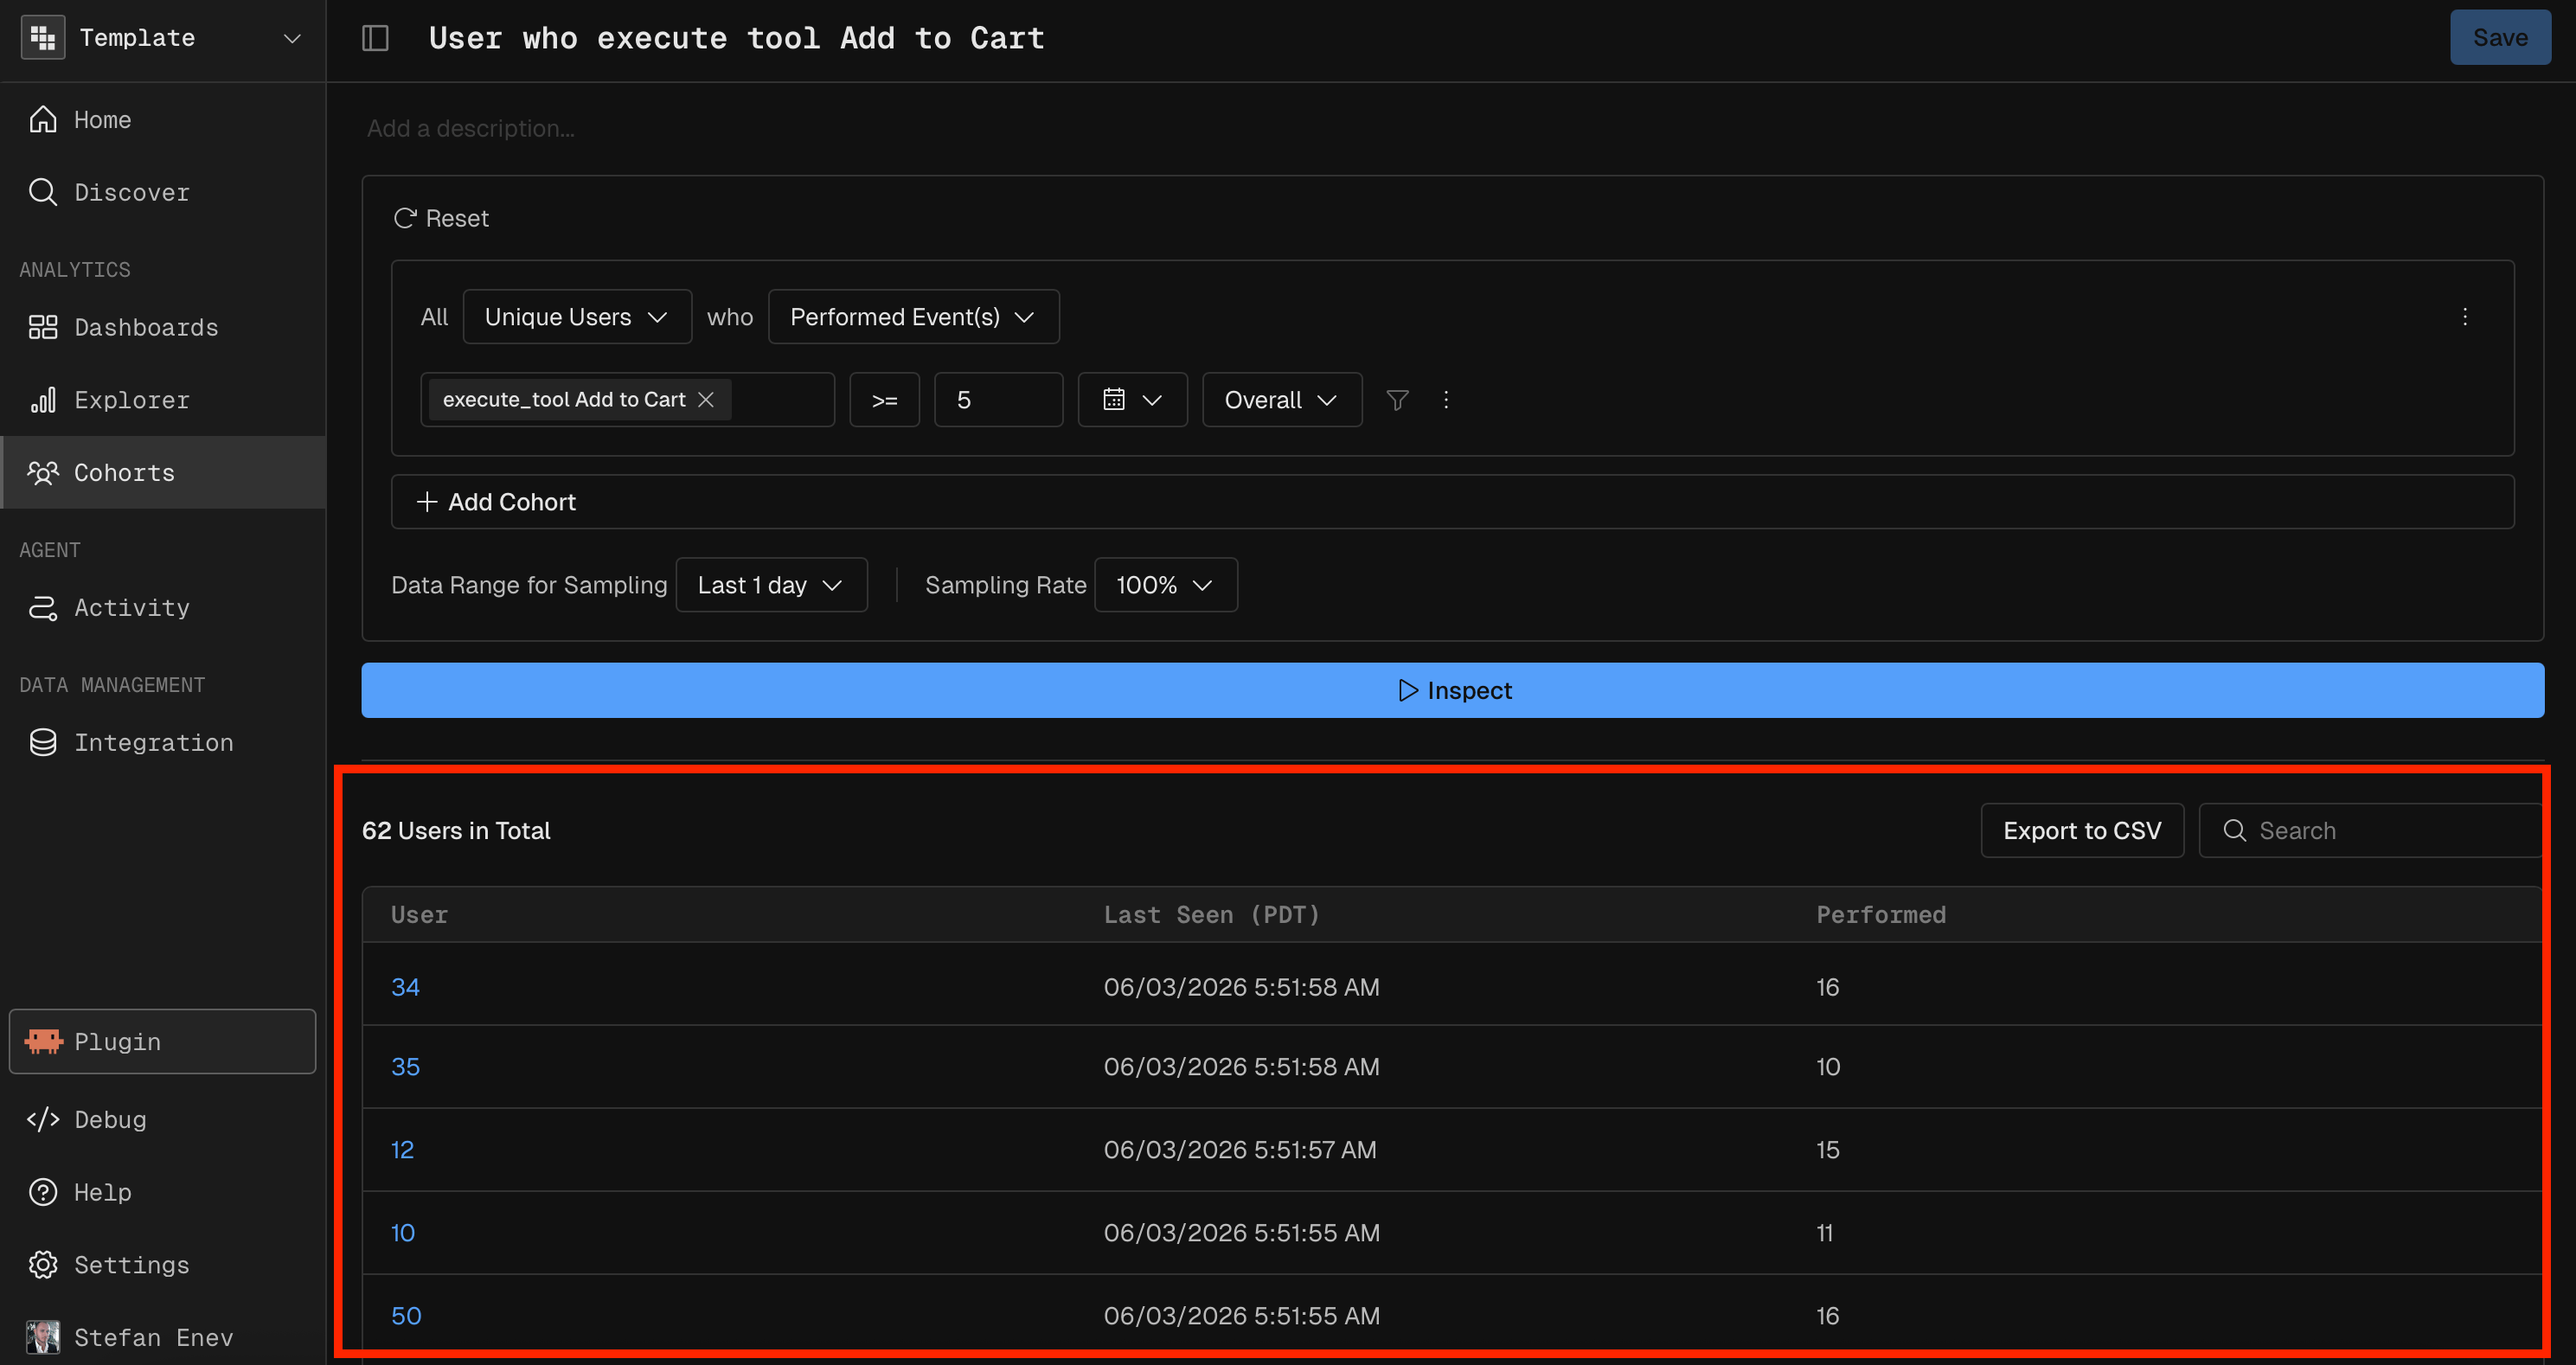
Before you save, click Inspect to run the cohort and see how many subjects match. The preview shows the total, for example62 Users in Total, and a table of subjects with their last seen time and how many times they performed the event. Export to CSV downloads the list.
Use cohorts in reports
Every report type can use a saved cohort in two ways: as a filter or as a breakdown segment.As a filter
A cohort filter limits the report to subjects in the cohort. The report runs as if the whole dataset were filtered to cohort members. To add one, click + next to Report Filter and pick Cohort Filter.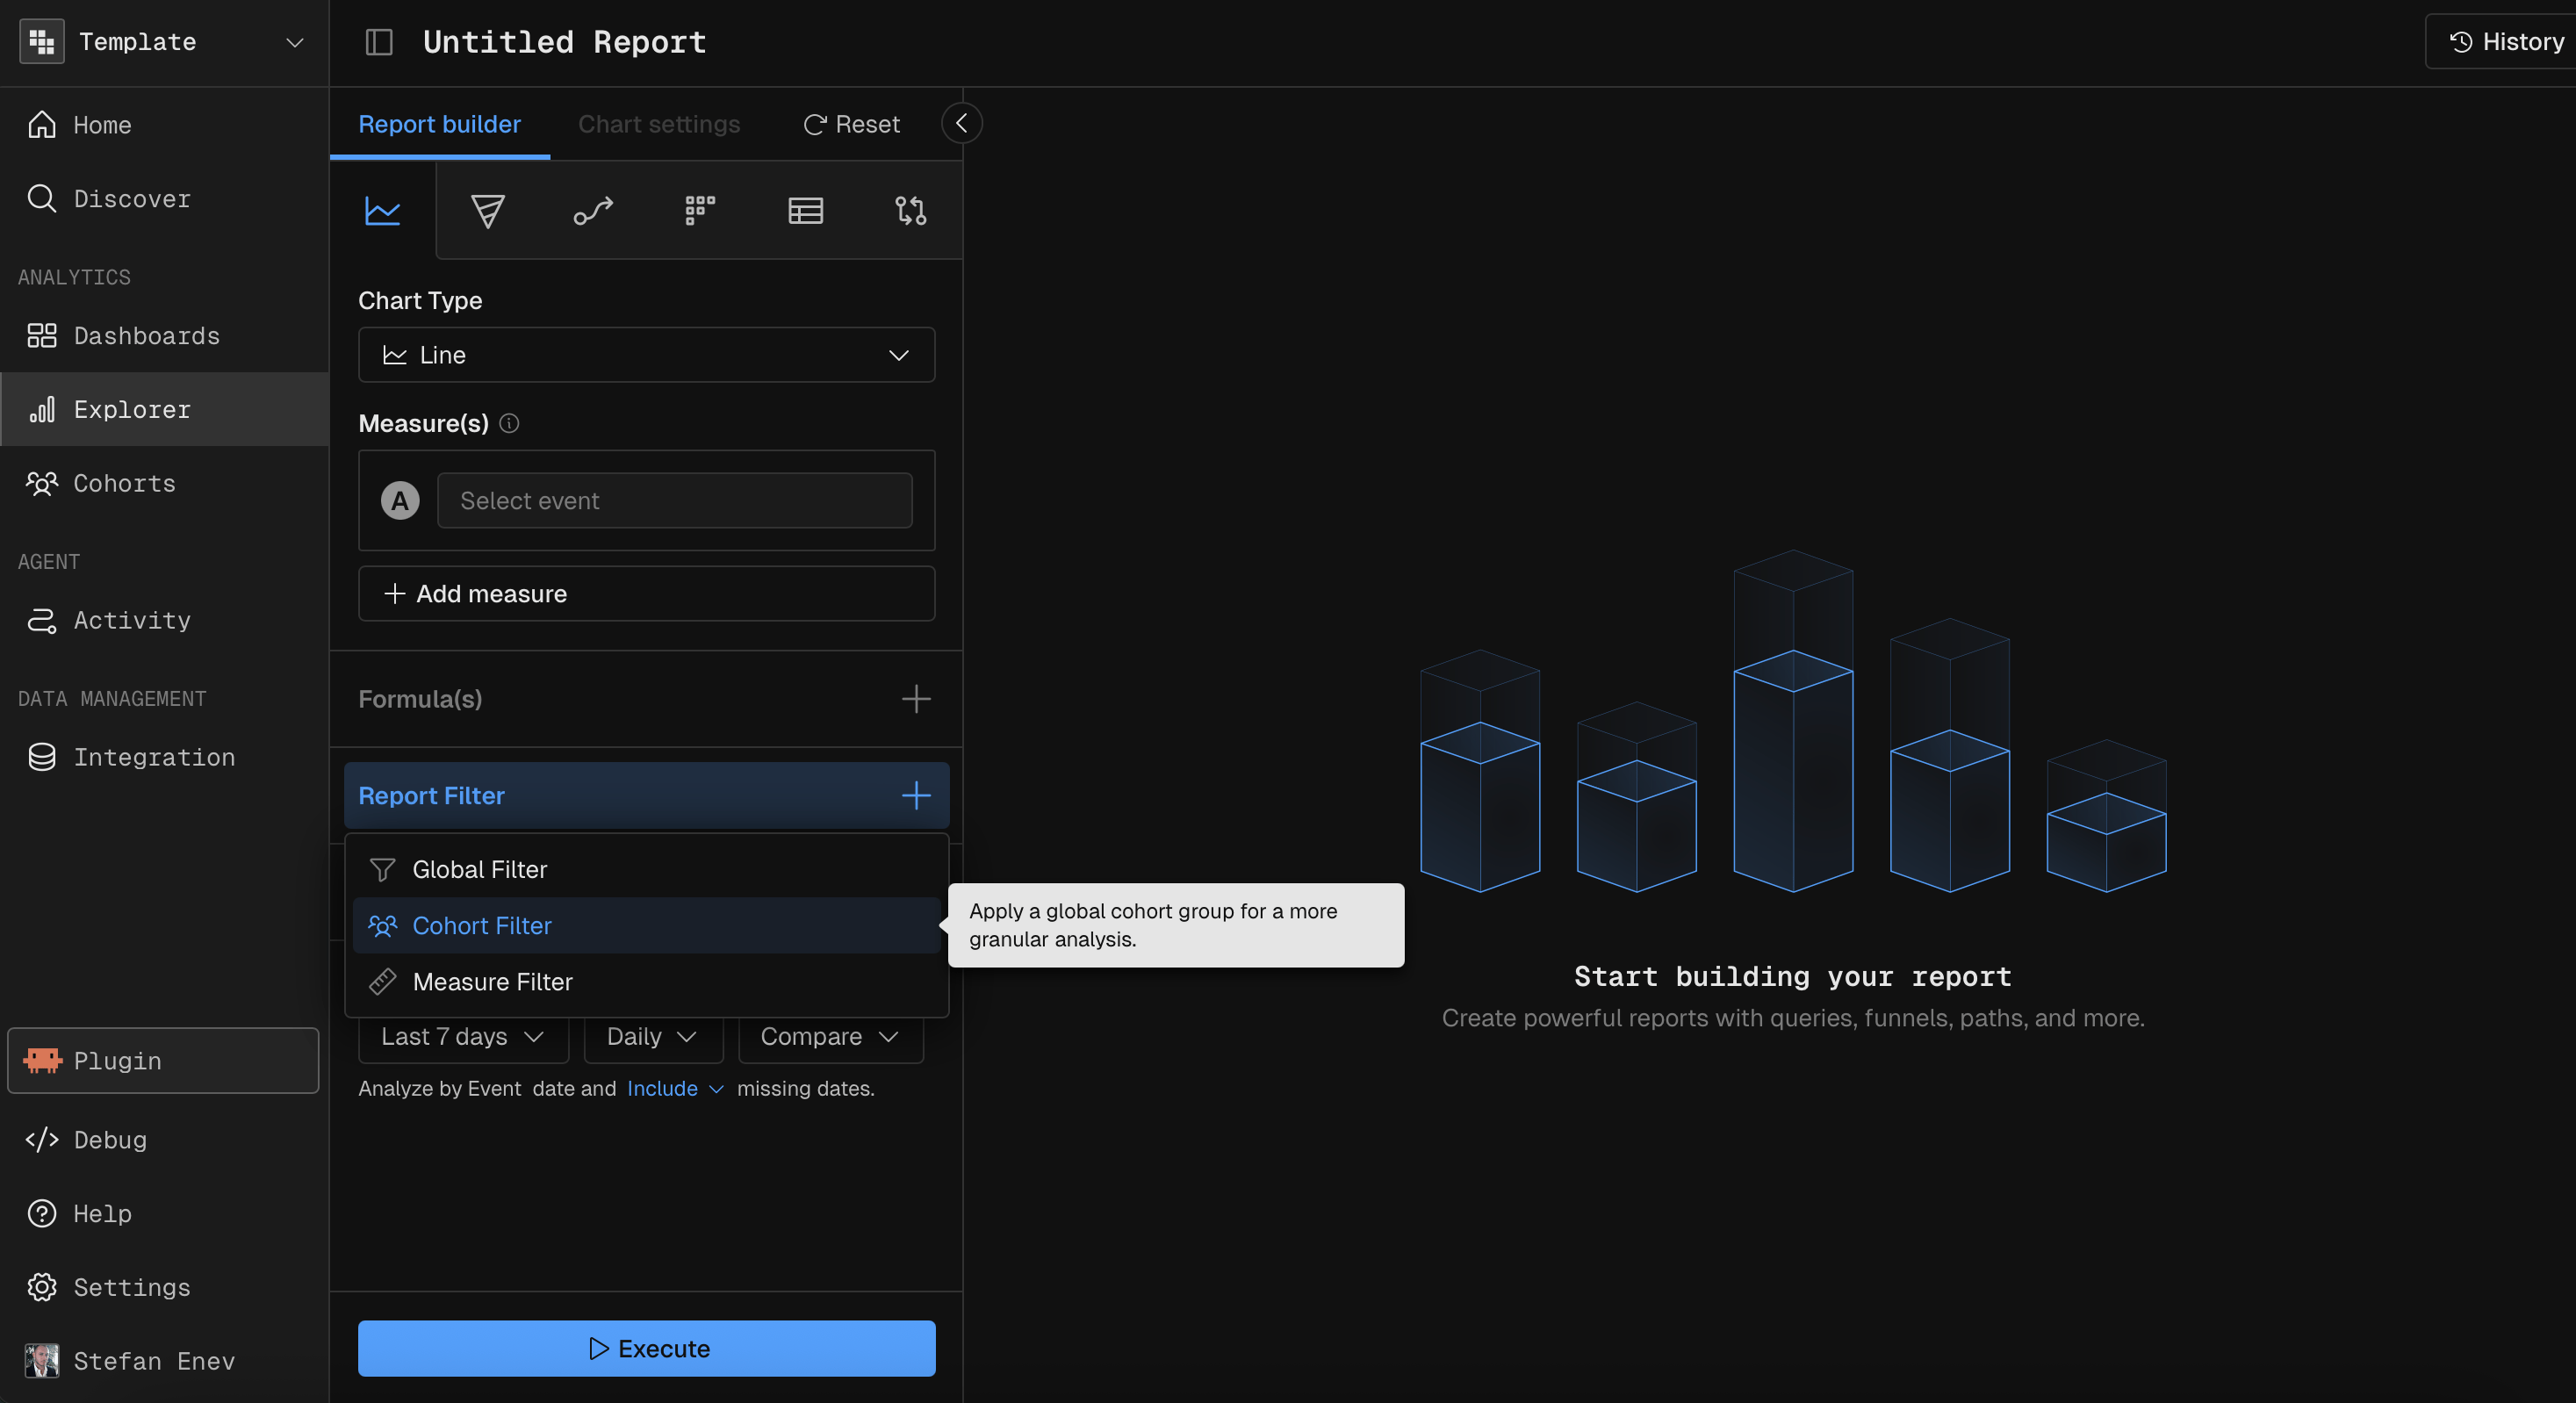
As a breakdown segment
A cohort breakdown splits the report’s results by cohort membership, next to any other Group By dimensions. To add one, click + next to Group By and pick Add cohort.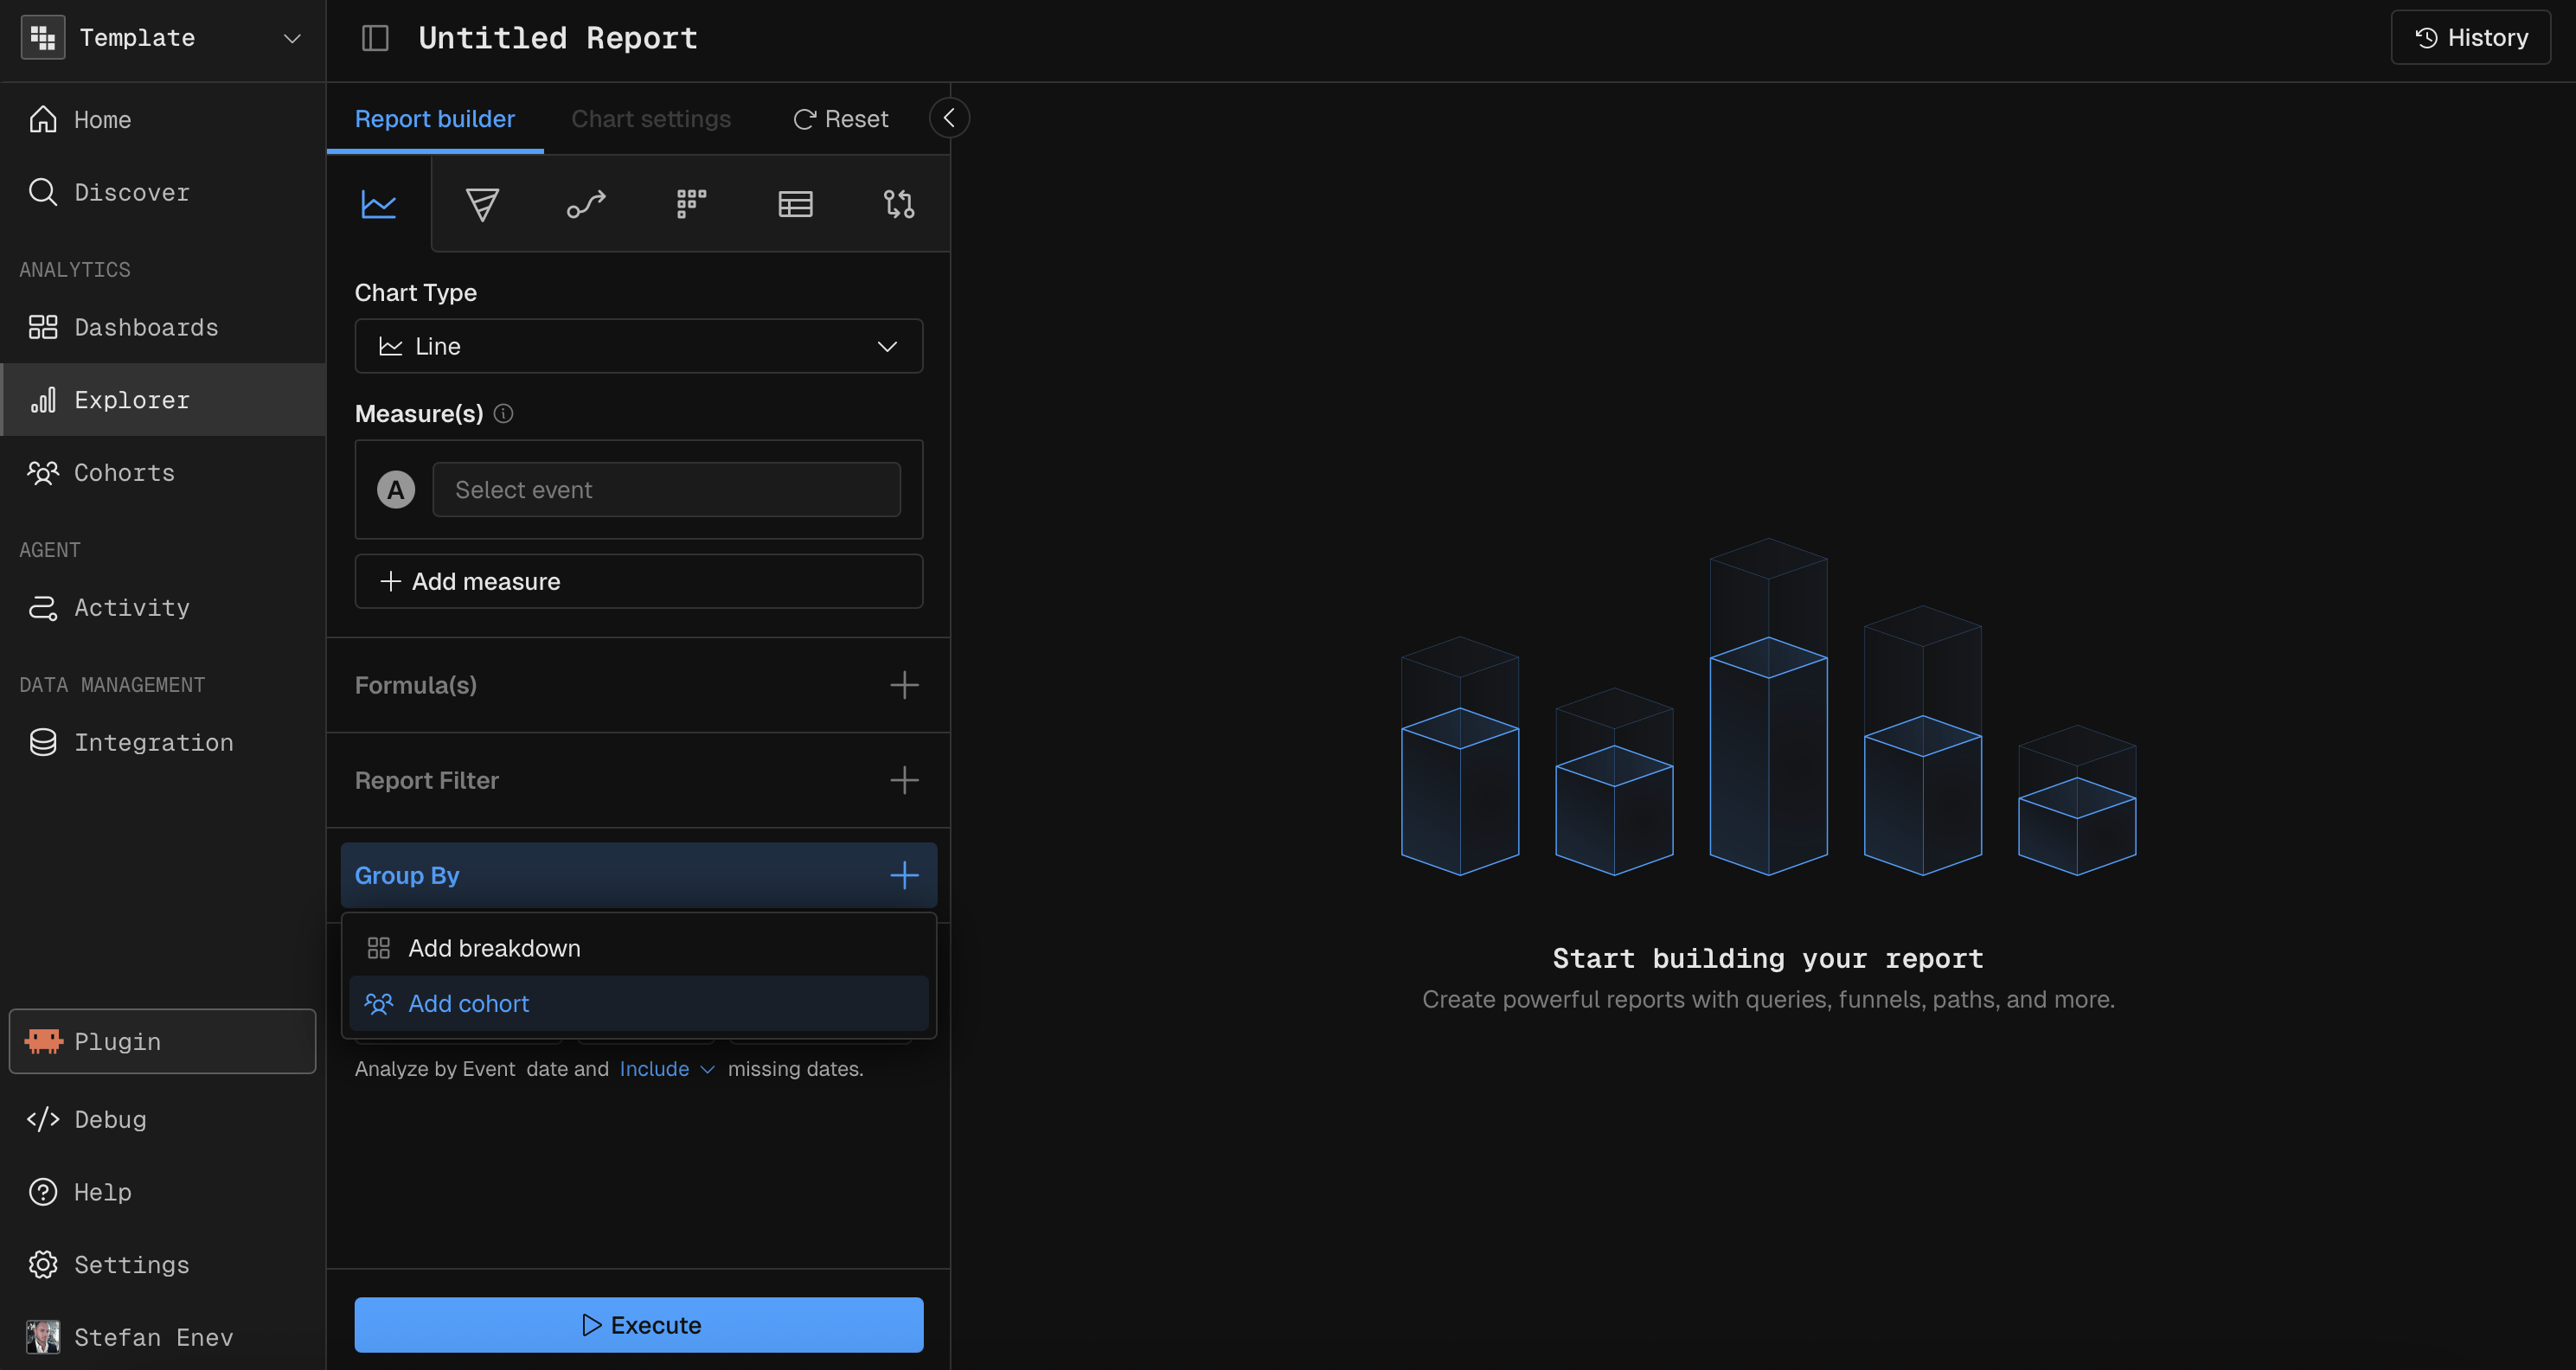
MCP prompt examples
“Create a cohort of users who triggered more than 10 tool calls in the last 30 days”
“Build a cohort of users who dropped off before step 2 of the onboarding funnel”
“Define a compound cohort: users who had more than 5 sessions AND whose average cost is above $1.00”
“Show me daily event count filtered to the ‘Power Users’ cohort over the last 30 days”
“Compare average latency between the ‘Free Tier’ and ‘Premium’ cohorts in a bar chart”
“Create a retention report for the ‘New Users’ cohort, starting event sign up, returning on any event”
Related
- Significance report: test whether a metric differs significantly between two cohorts.
- Group By and binning: the other dimensions a cohort breakdown sits next to.
- Filters: global and measure filters, next to cohort filters.