

When to use
Data Table or a Query report’s table view
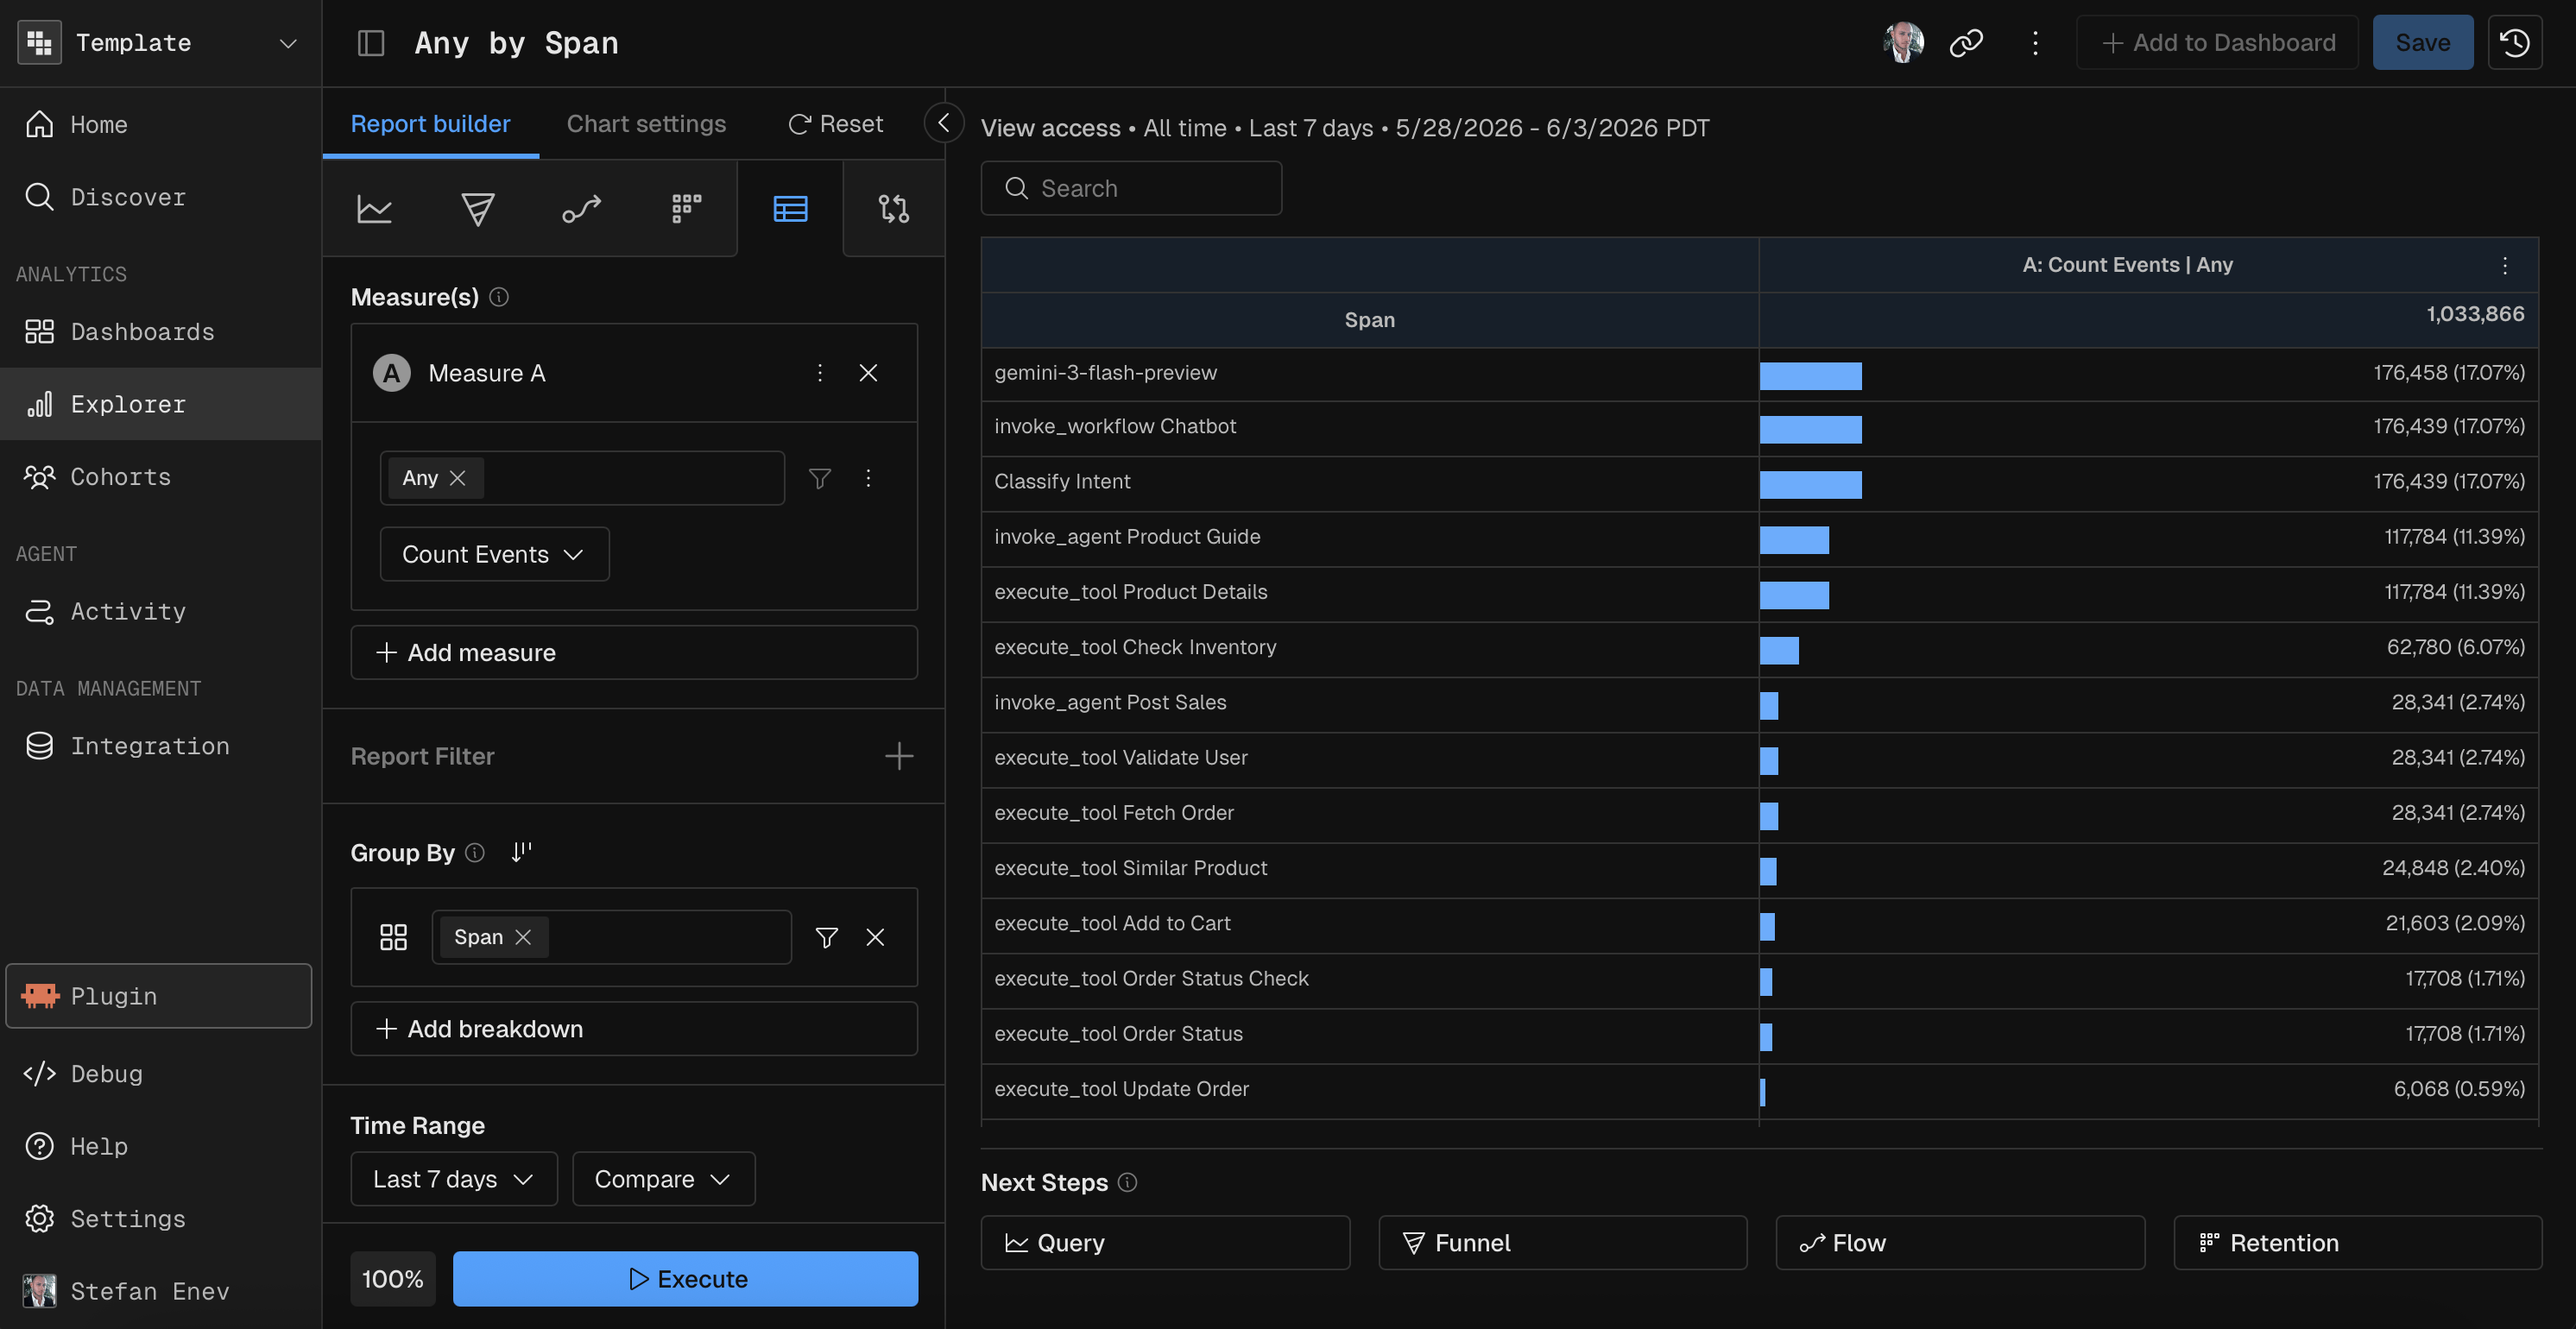
Measures
A measure is a function applied to a field. A Data Table report aggregates one or more measures. The measure functions are Count, Count Distinct, Sum, Avg, Min, Max and Percentile.Group By
Group By sets the dimensions that make up the table’s rows. Each unique combination of dimension values is one row. Each Group By field can have binning (Range, Enum, Date or Named) and its own filters. Group By and binning covers the binning options.
The limit of 5 groups is more than the 2 that Query reports allow, which makes Data Table the report for multi-dimensional exploration.
Compare
Compare puts the current period next to an earlier one. When you pick a comparison period, each measure column splits into current and previous values side by side. Compare covers comparison across report types.
A custom date is also available.
Percent change
When a comparison is on, turn on Show % Change to add a column with the relative change between the two periods. Increases show in green and decreases in red.Time granularity
A Data Table report supports every time granularity, not only All Time.Table display
The table has sorting, inline visualizations and CSV export.Column sorting
Click a column header to sort the table by that column. Sorting works on text and numbers, ascending or descending.Inline visualizations
Export
To download the table as a CSV file, open the options menu (the three-dot icon) and click Export as CSV.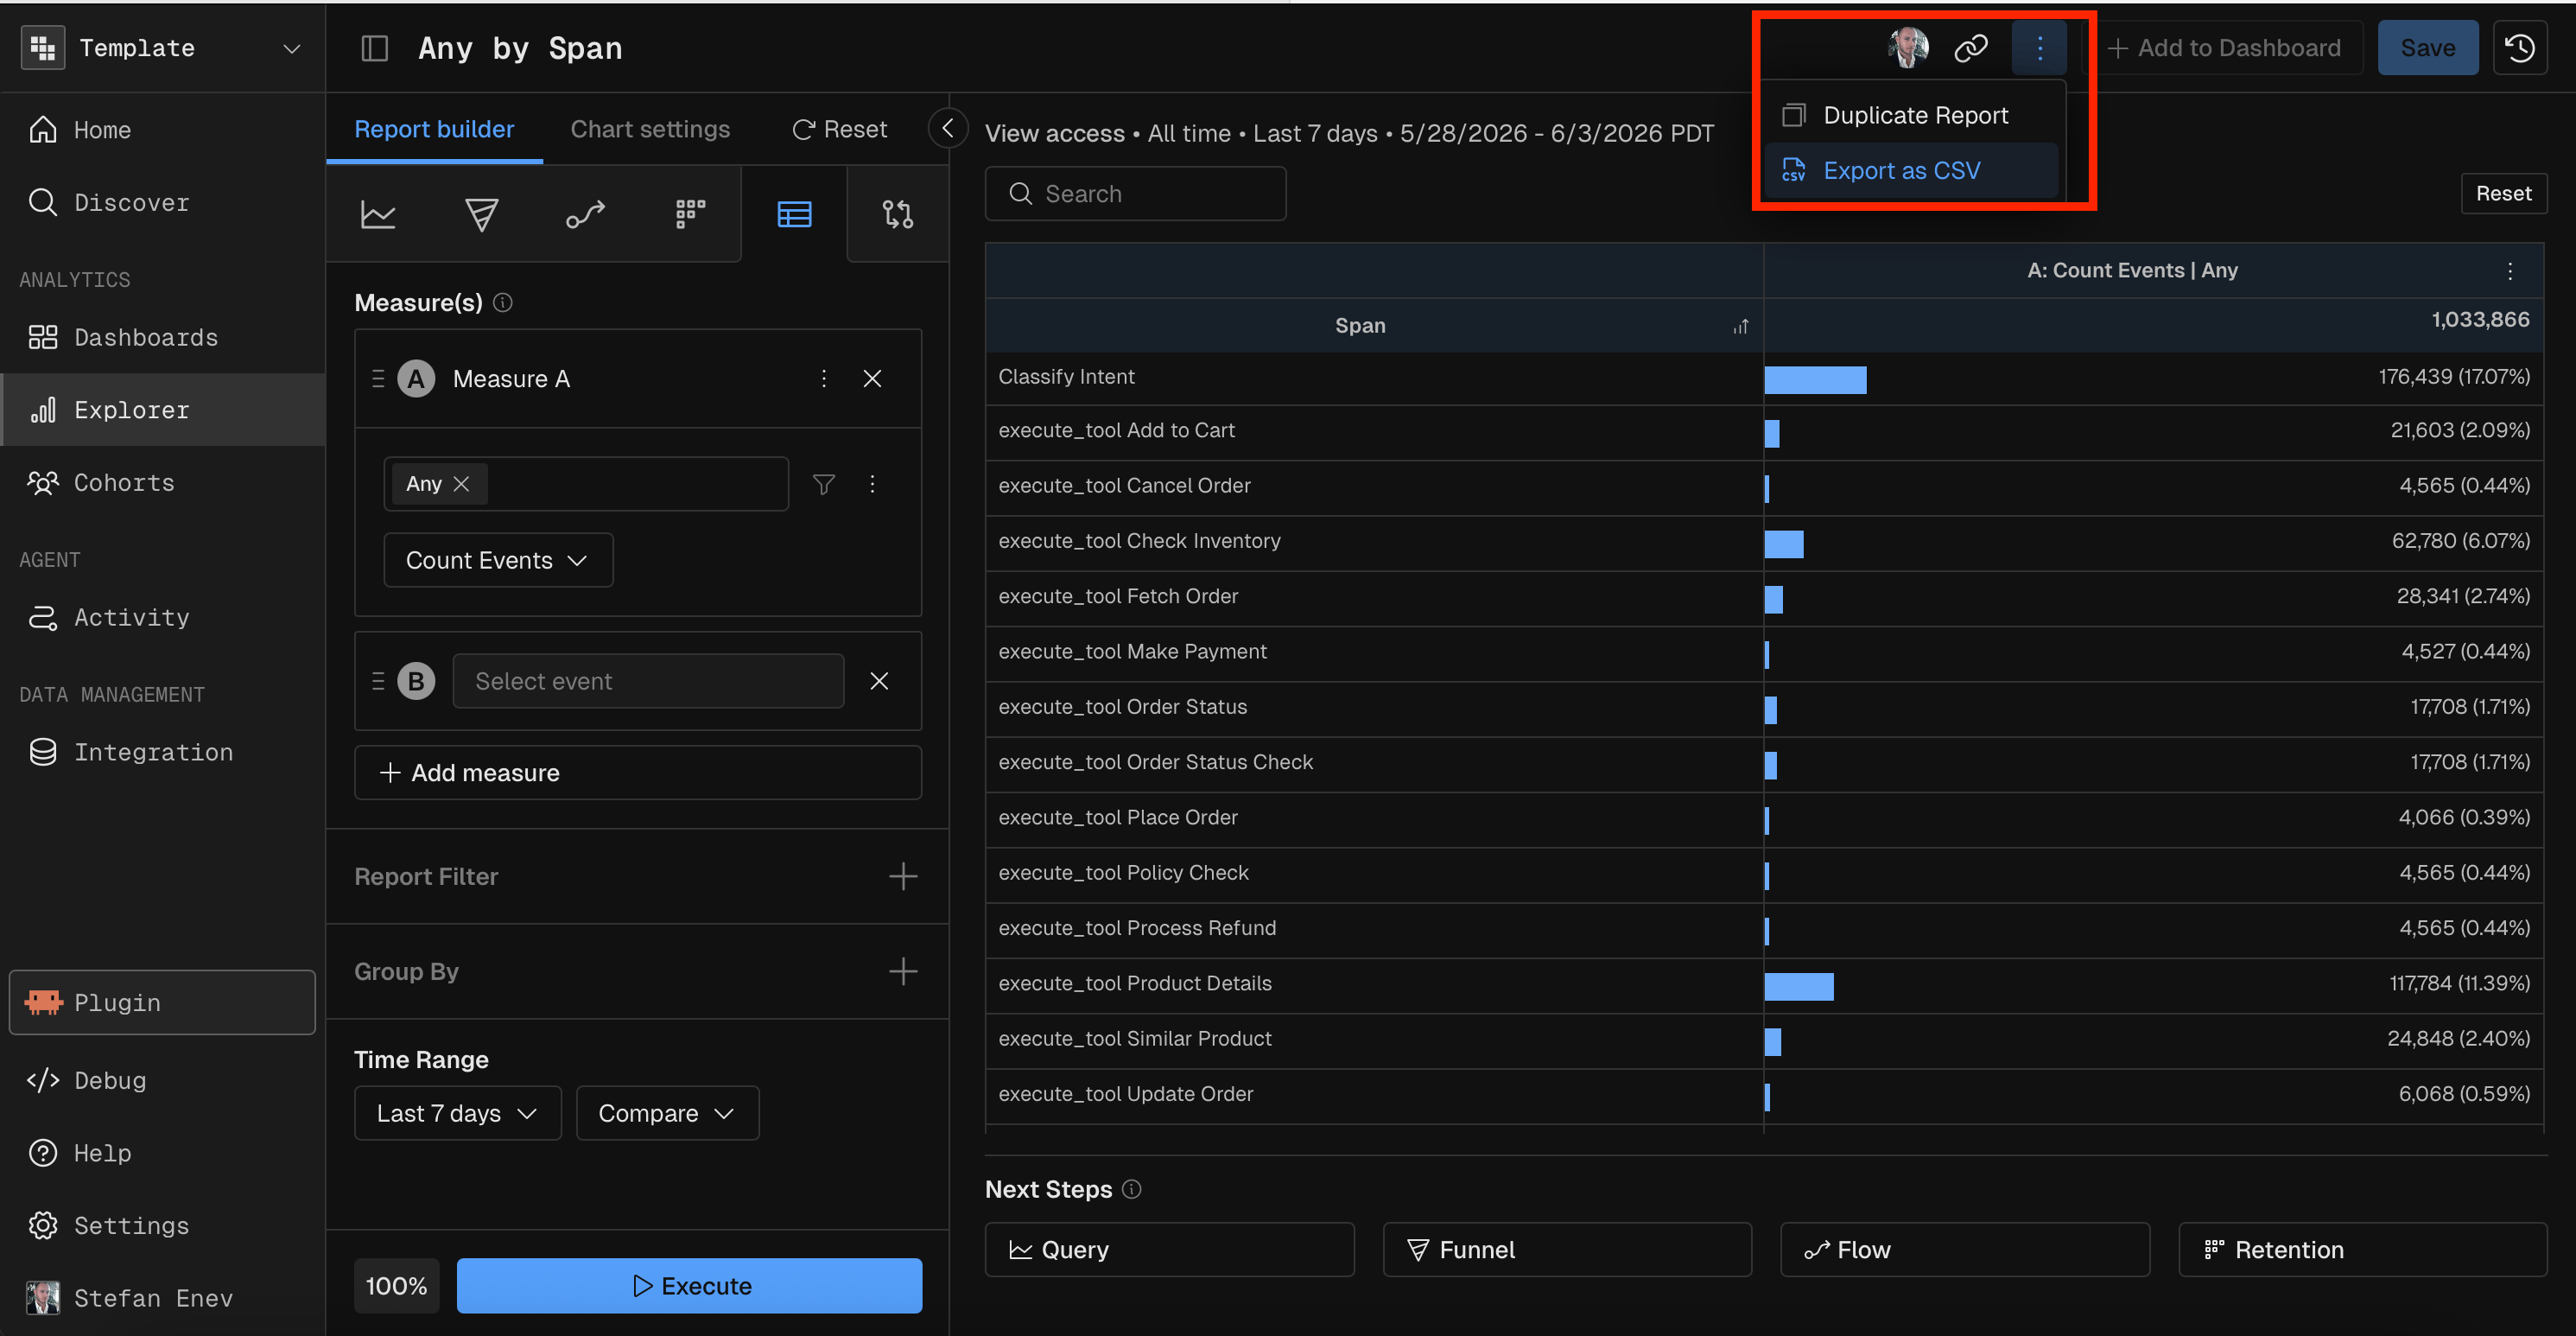
MCP prompt examples
A Data Table prompt for the Kubit MCP server names the measures, the Group By dimensions (up to 5) and the date range. Add the time granularity when it isn’t All Time (“daily”, “weekly”, “monthly”), a comparison period (“compared to last week”) when you need one, and any filters.“Create a data table of event count by model name over the last 7 days”
“Build a data table of daily average latency and total cost by model name and environment for the last 30 days”
“Show me a data table of count distinct users, average latency, and P95 latency grouped by model, span type, trace name, environment, and status code over the last quarter”
Related
- Query report: chart a measure over time, with formulas.
- Filters: narrow the rows a Data Table report aggregates.
- Dashboards: add a Data Table report to a dashboard.