

When to use
Create a dashboard
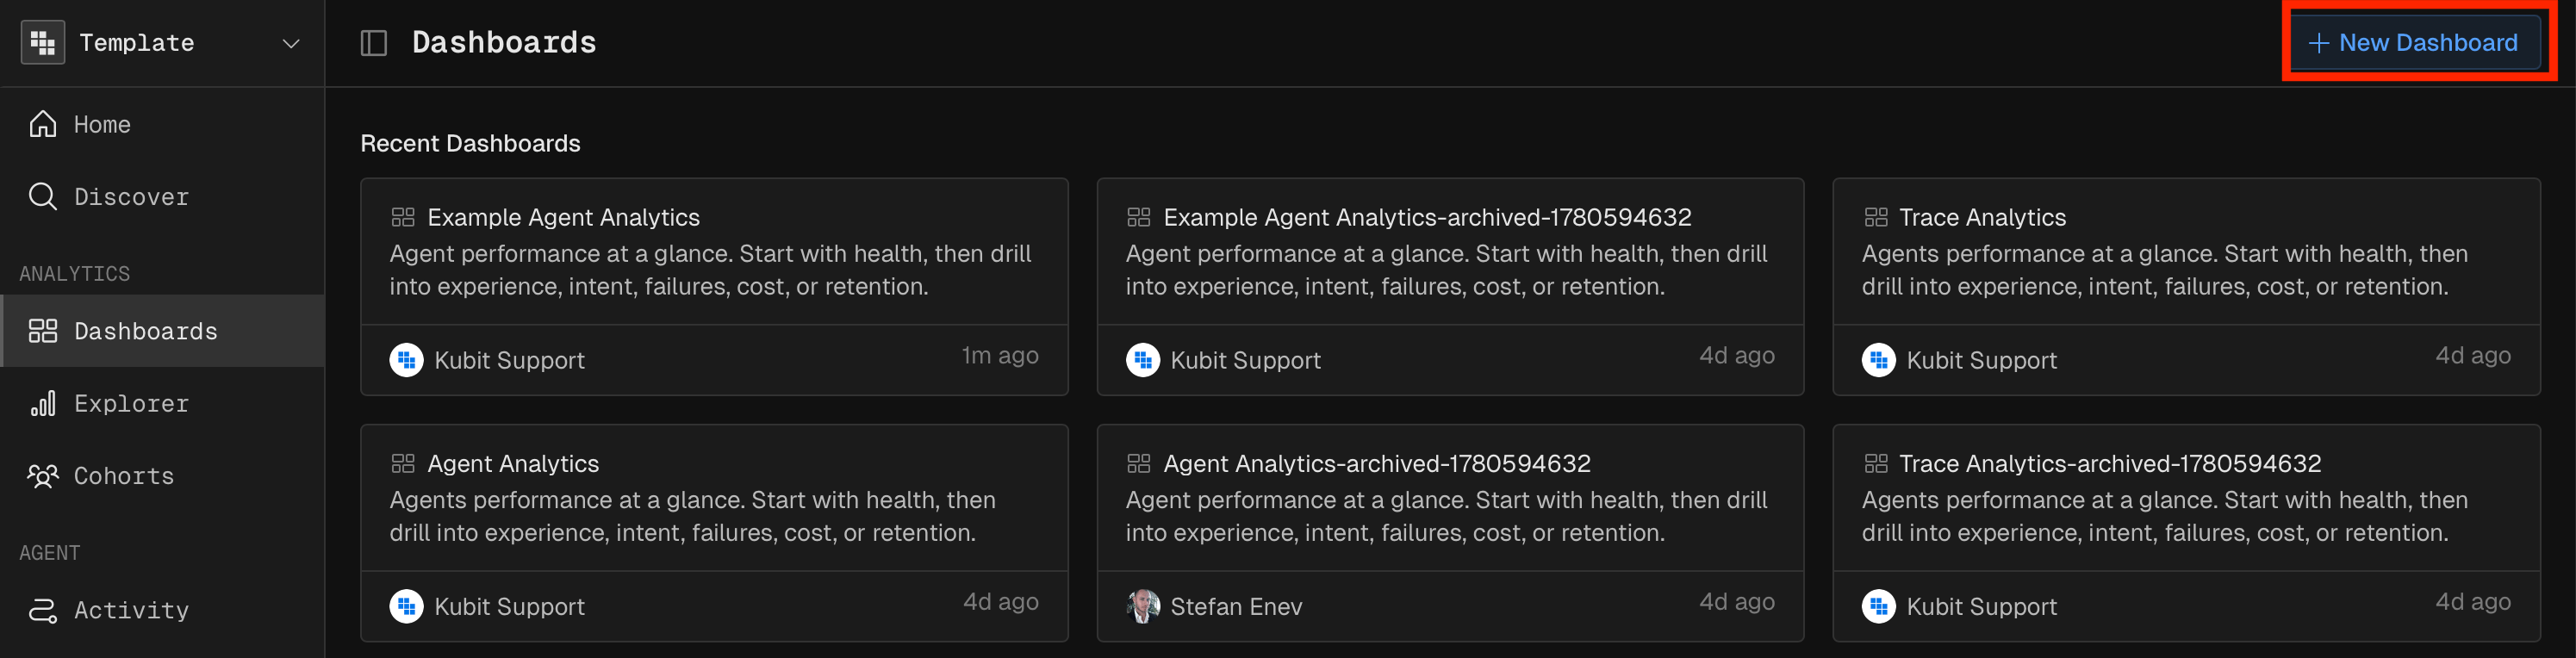
Click New Dashboard on the Dashboards page. A new dashboard is namedUntitled Dashboard and starts with an empty canvas. Rename it and add a description right away.
You can also create a dashboard while you add a report to one. The Add to Dashboard dialog has a New Dashboard option that creates the dashboard and adds the report in one step.
MCP prompt examples
“Create a dashboard called Support agent health”
“Add my Sessions last 7 days report to the Support agent health dashboard”
Add content
A dashboard holds four types of content: reports, rich text, images and media embeds. In edit mode, the + Add Content menu inserts content at any position in the grid.Reports
A dashboard can show Query, Funnel, Retention, Path, Data Table and Significance reports. There are two ways to add one.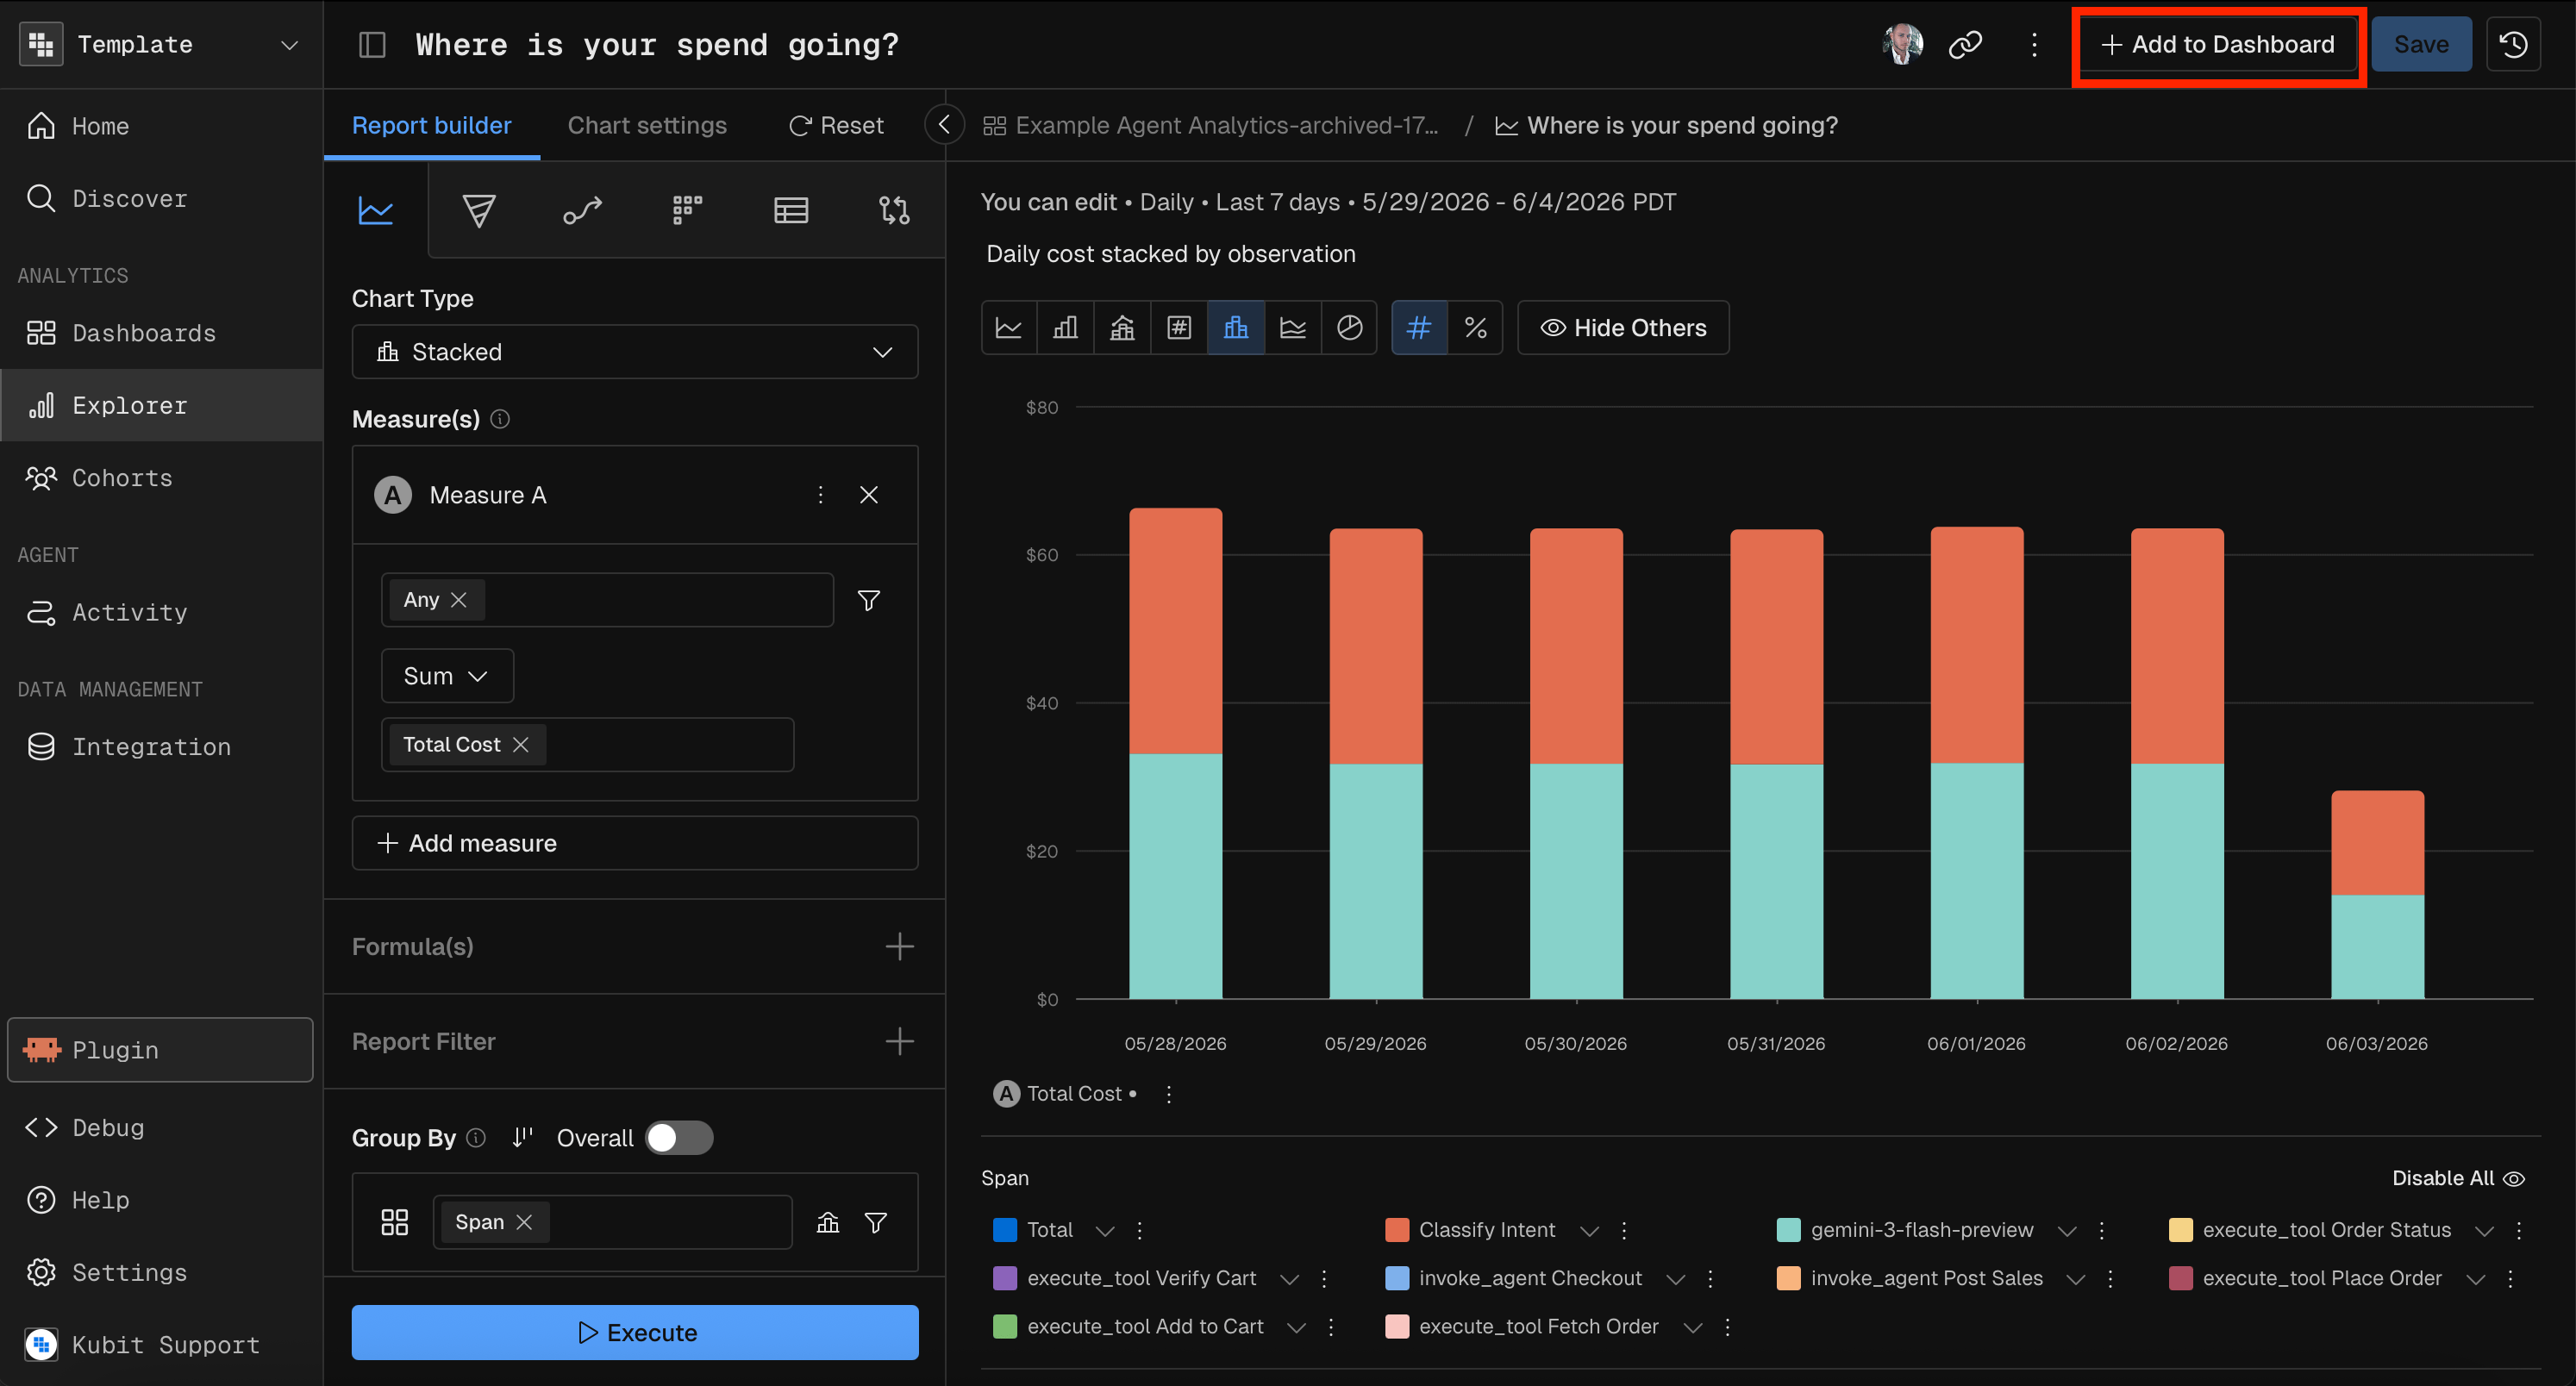
Rich text
Rich text blocks hold context, notes, section headers or instructions. Click a block to edit it in place. Changes save when you click outside the block.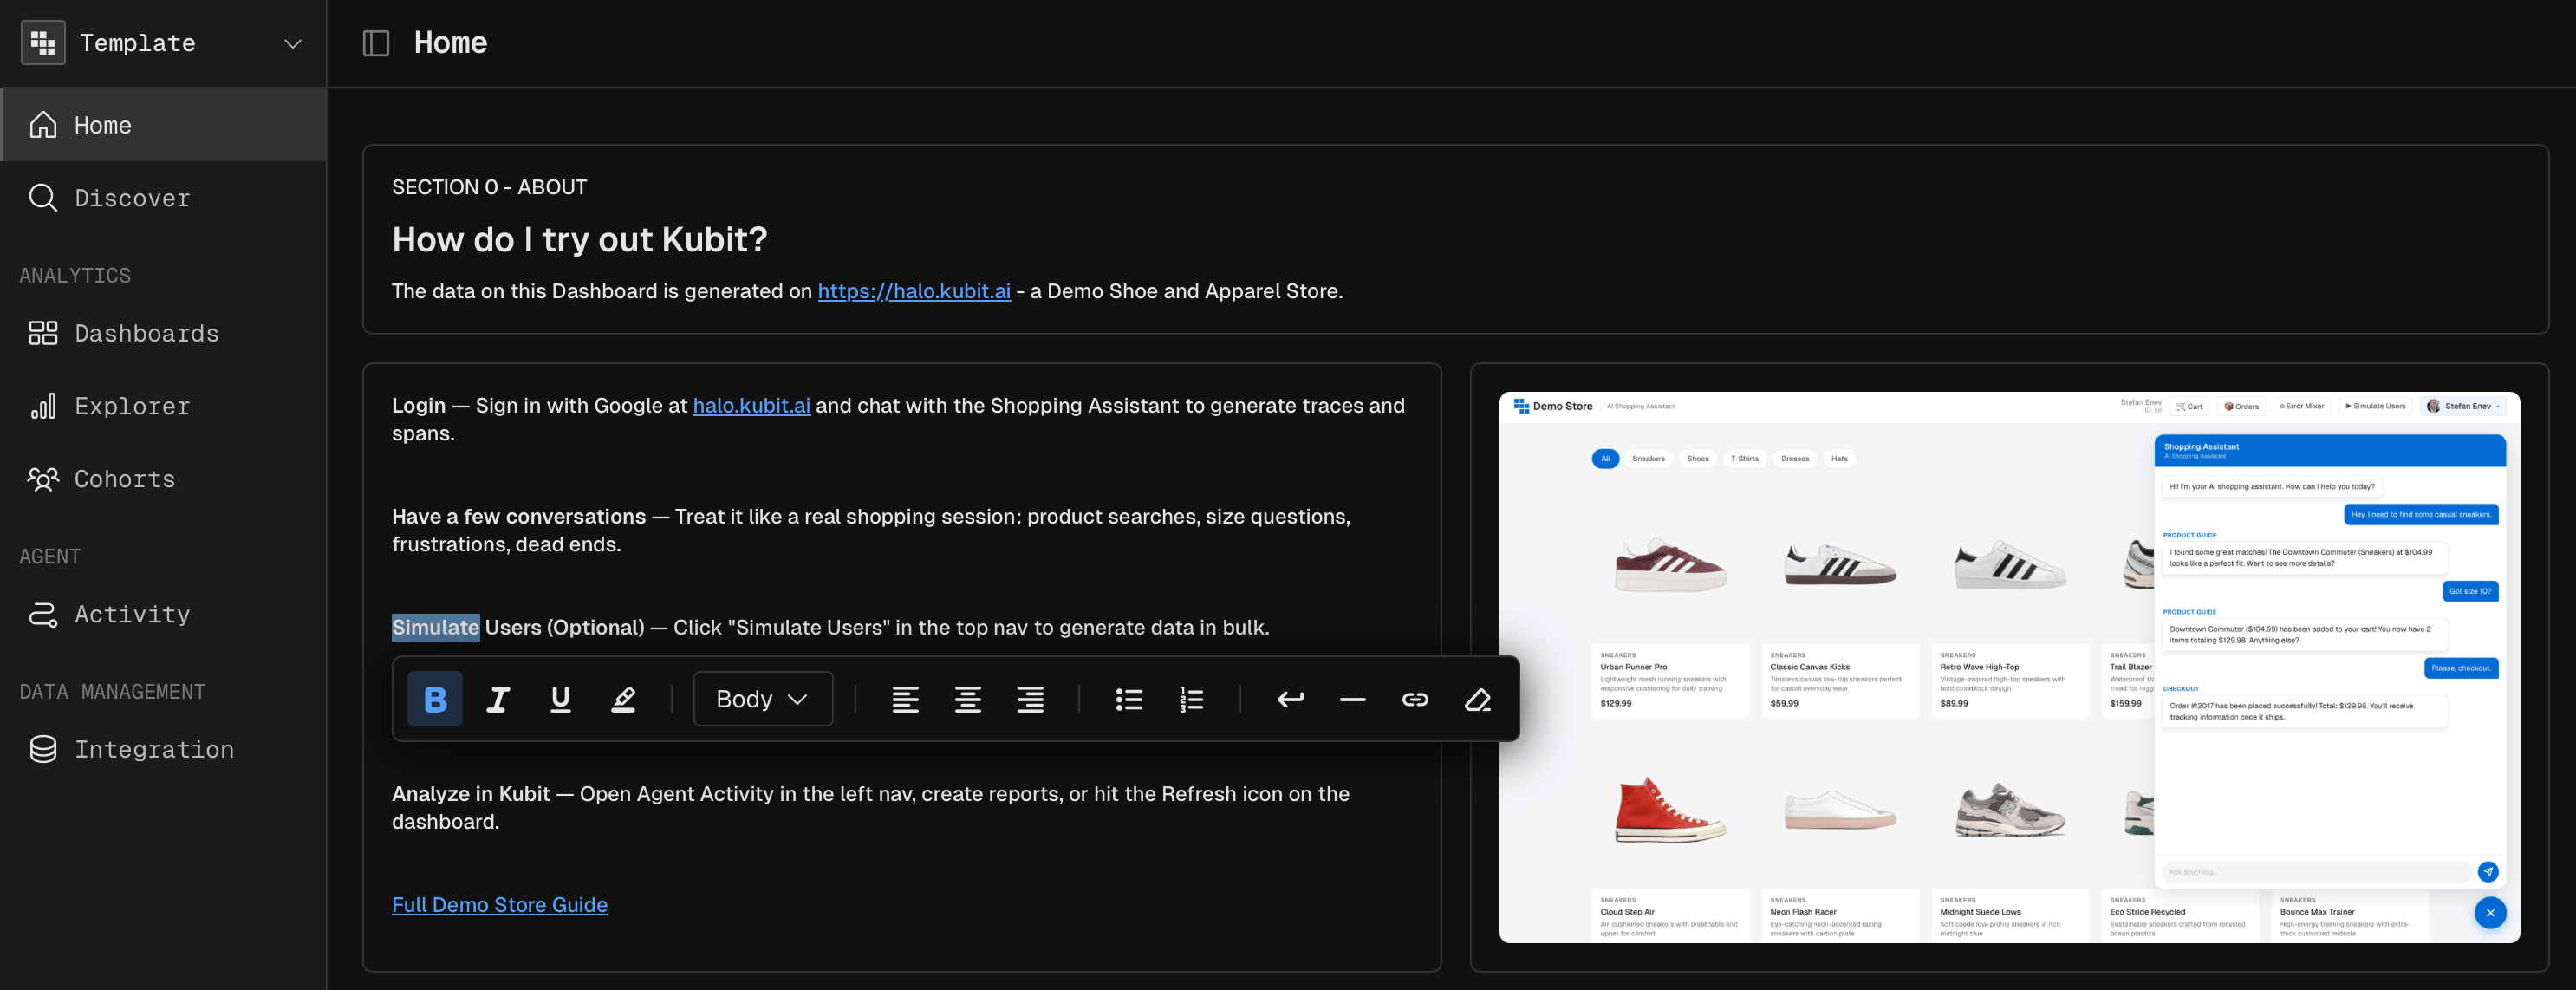
Images
Upload an image file. Kubit stores it and shows it at the full width of its grid cell. Use images for screenshots, diagrams, architecture charts or branding.Media embeds
Paste a video URL to embed a player in the cell.MCP prompt examples
“Add a text block above the charts on the Support agent health dashboard that explains what each section covers”
Remove content
To remove content, open the cell’s options menu (the three-dot icon) and click Delete From Dashboard. The other cells in the row widen to fill the space, and empty rows are removed.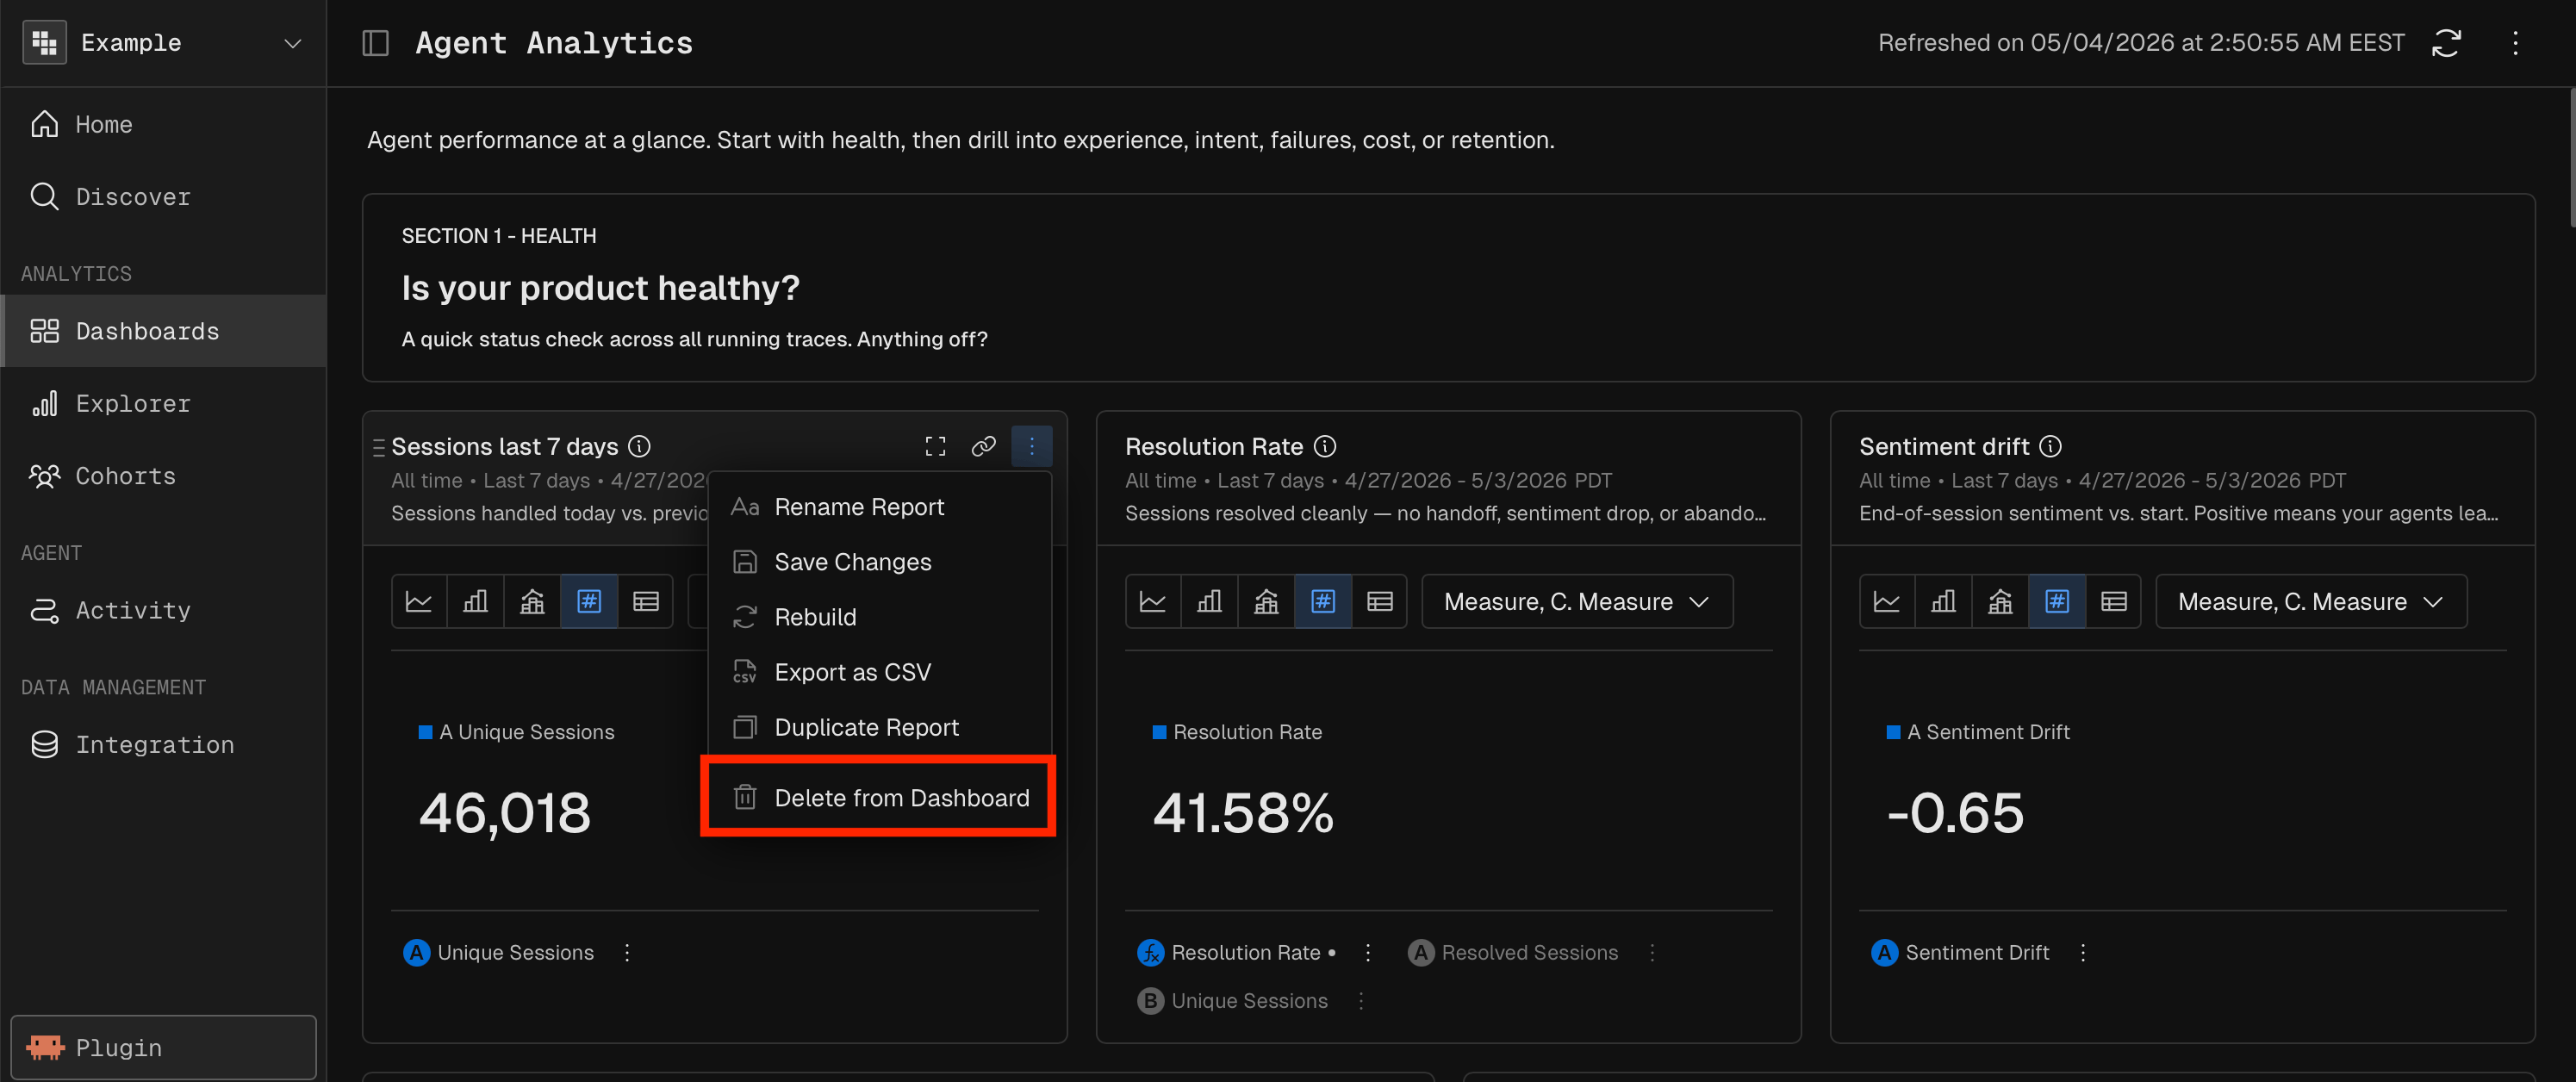
Layout
A dashboard is a 12-column grid. Content sits in rows, and each row holds up to 3 cells. The cells in a row share its 12 columns.Edit mode and view mode
Drag and drop
In edit mode, grab a cell by its drag handle and move it. A preview shows where it will land. A cell can move within its row or to another row.Resize
Insert at a position
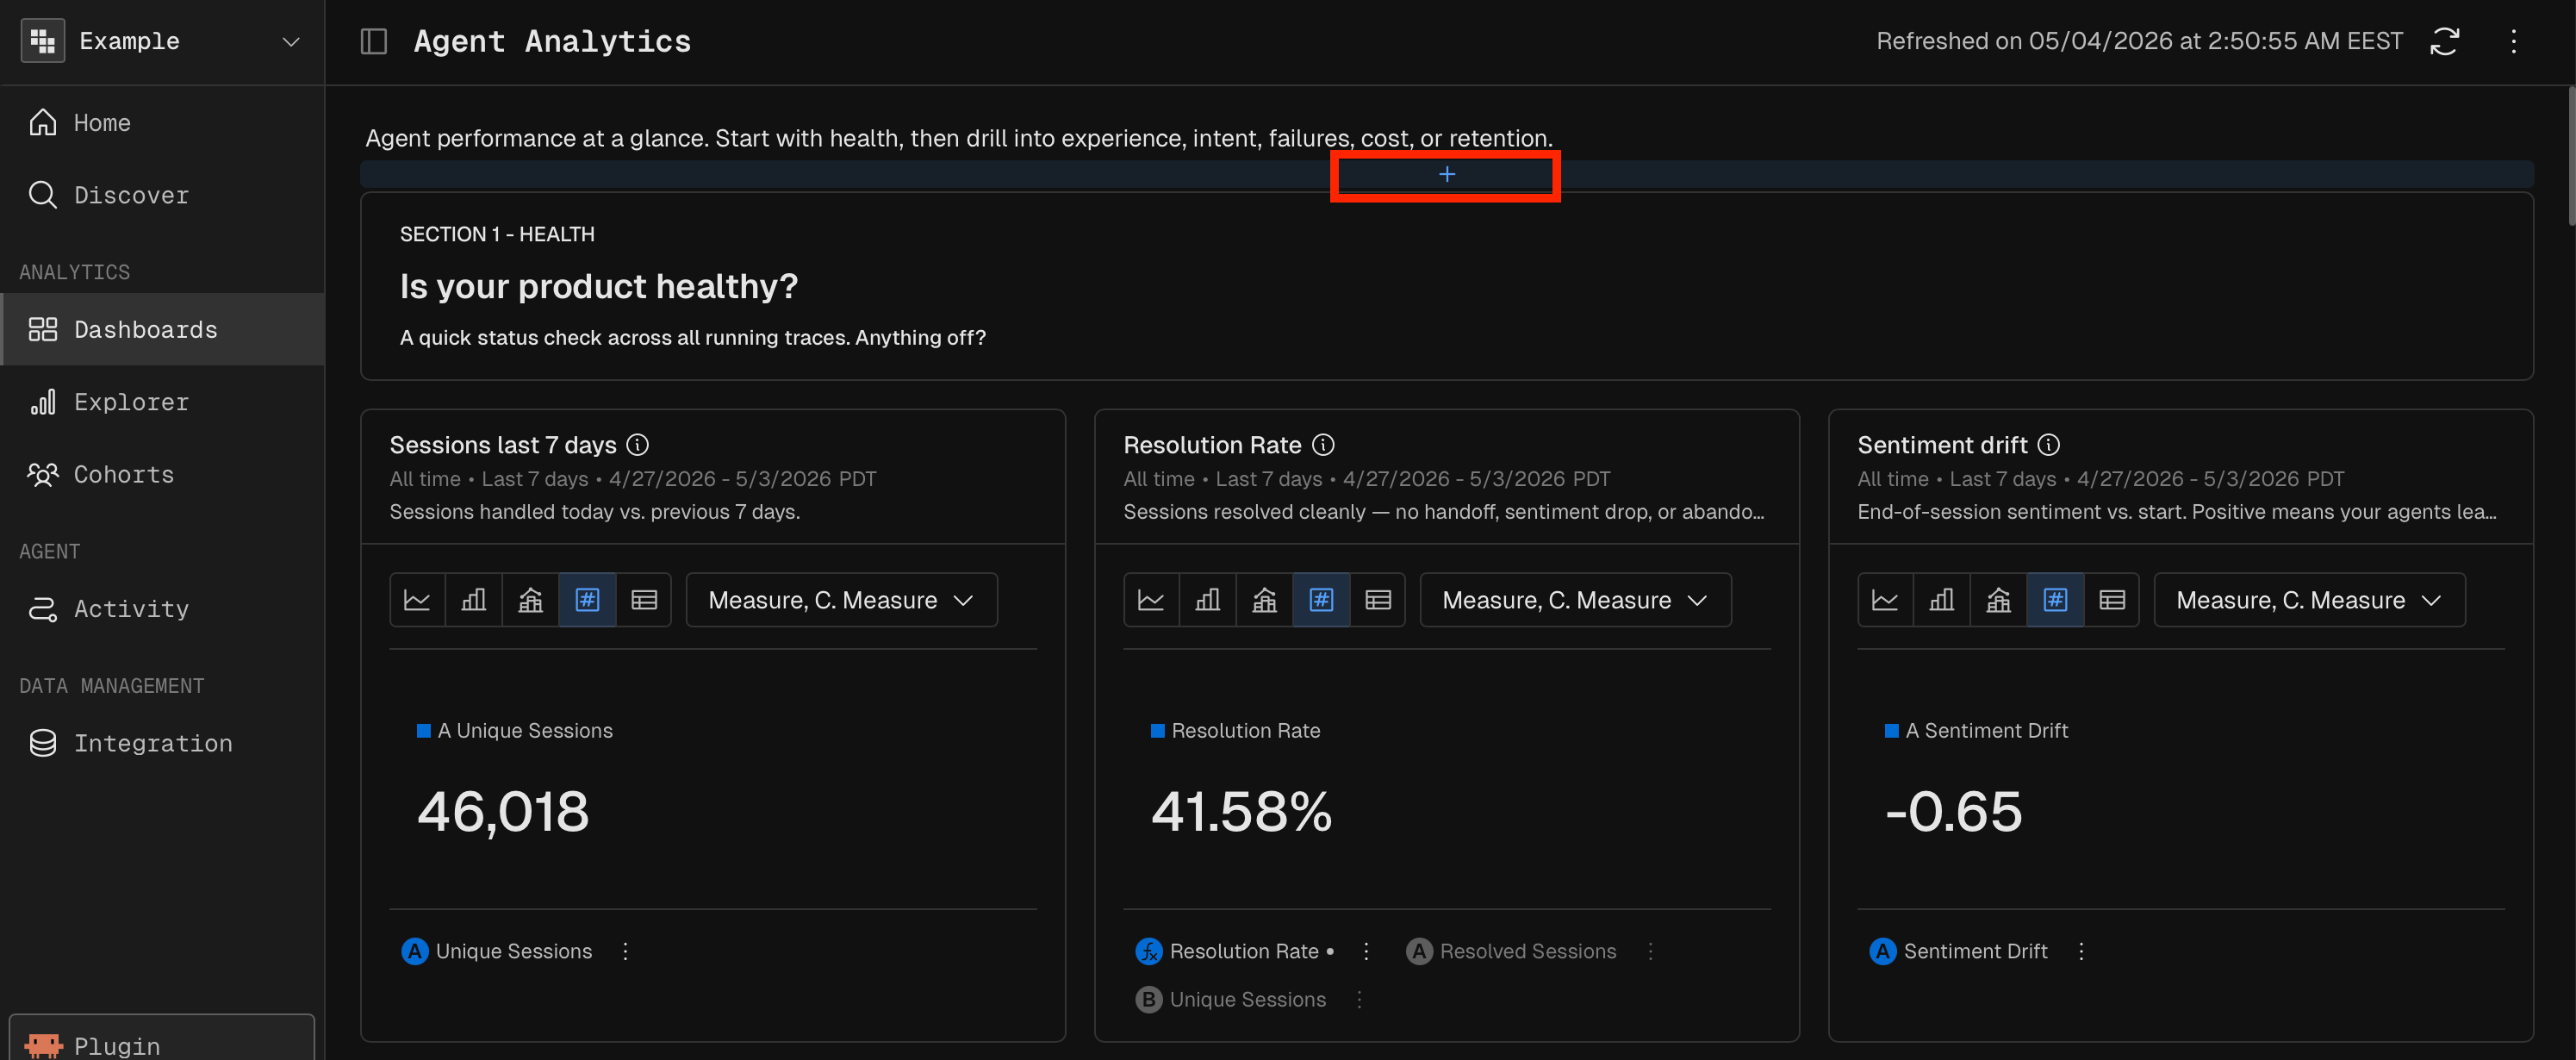
The + buttons on row and column borders insert new content before, after or between cells.Edit and replace charts
A chart on a dashboard is a read-only view of a saved report. To change its query, measures or settings, open the report in the report builder. Kubit asks before it replaces the chart on the dashboard, so a shared dashboard doesn’t change by accident.How it works
- Click the chart’s title on the dashboard. The report opens in the report builder.
- Make your changes and run the report again.
- A banner reads
Your report has been re-executed, would you like to replace it in "{Dashboard Name}" dashboard? - Click Replace to update the dashboard. Close the banner to keep the previous version.
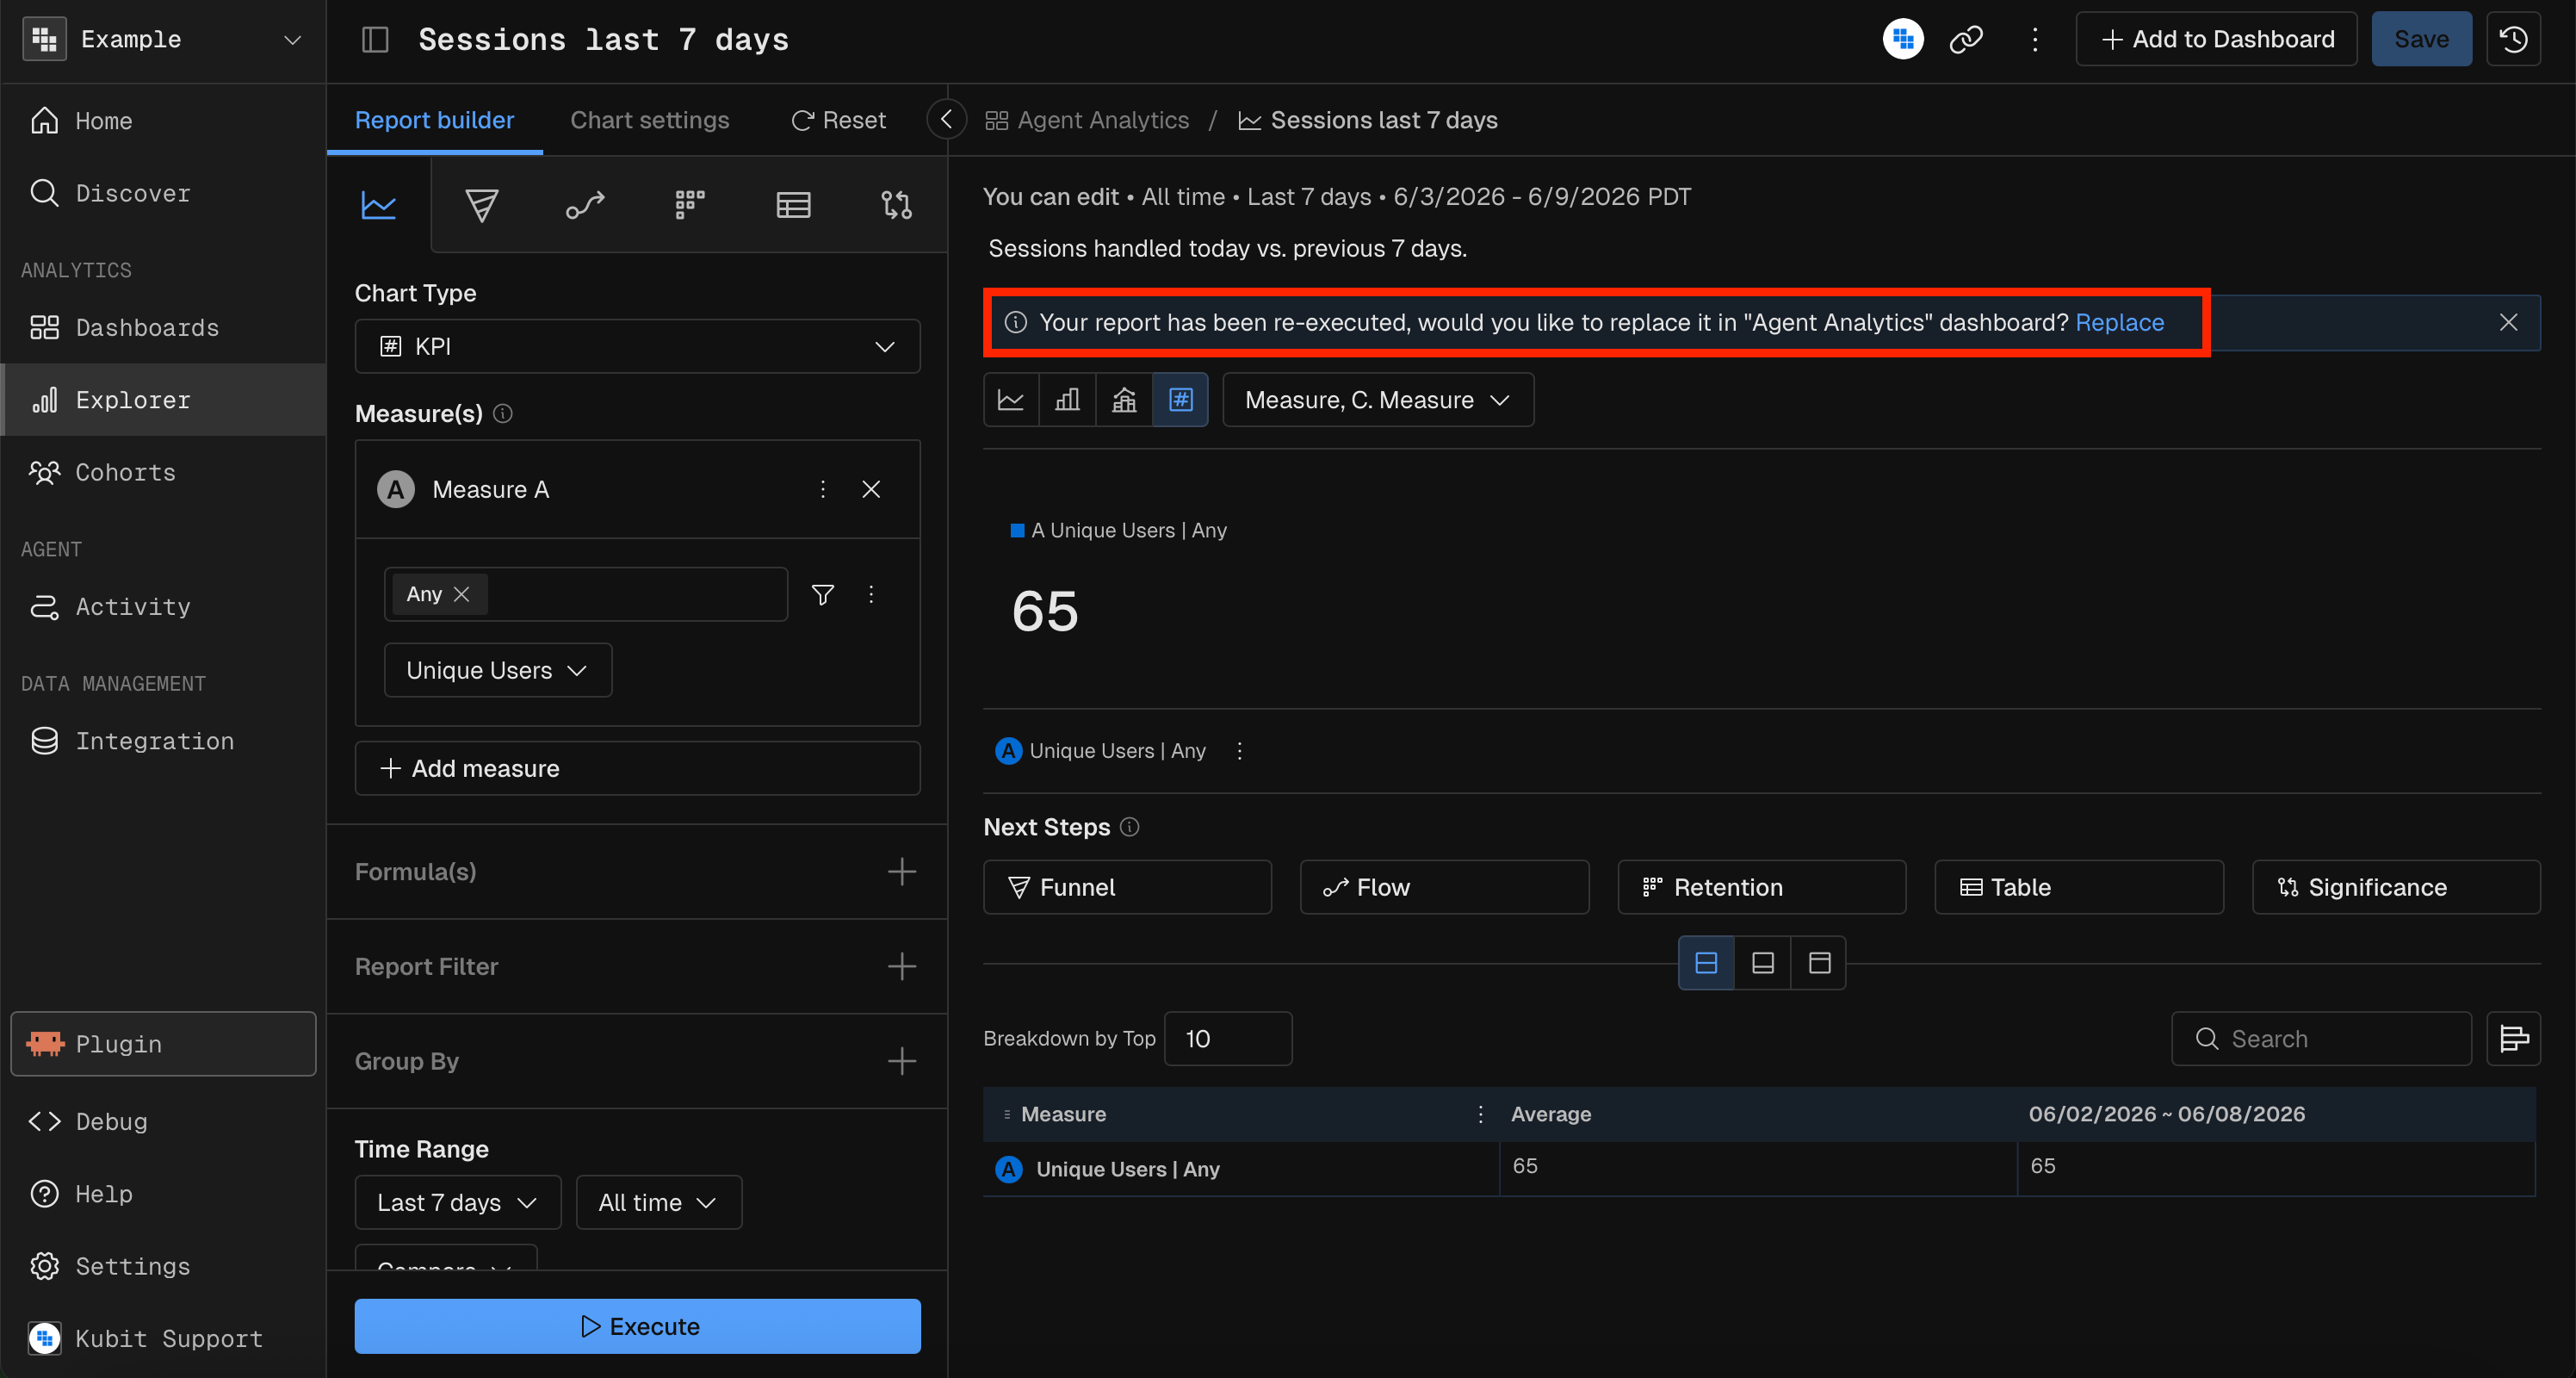
Chart options
Each chart cell has an options menu (the three-dot icon). Which actions you see depends on your permissions and the report’s state.MCP prompt examples
“Change the Sessions last 7 days report on the Support agent health dashboard to show the last 30 days”
Dashboard settings
The dashboard header has a refresh icon and an options menu (the three-dot icon) with Clone This Dashboard and Delete Dashboard.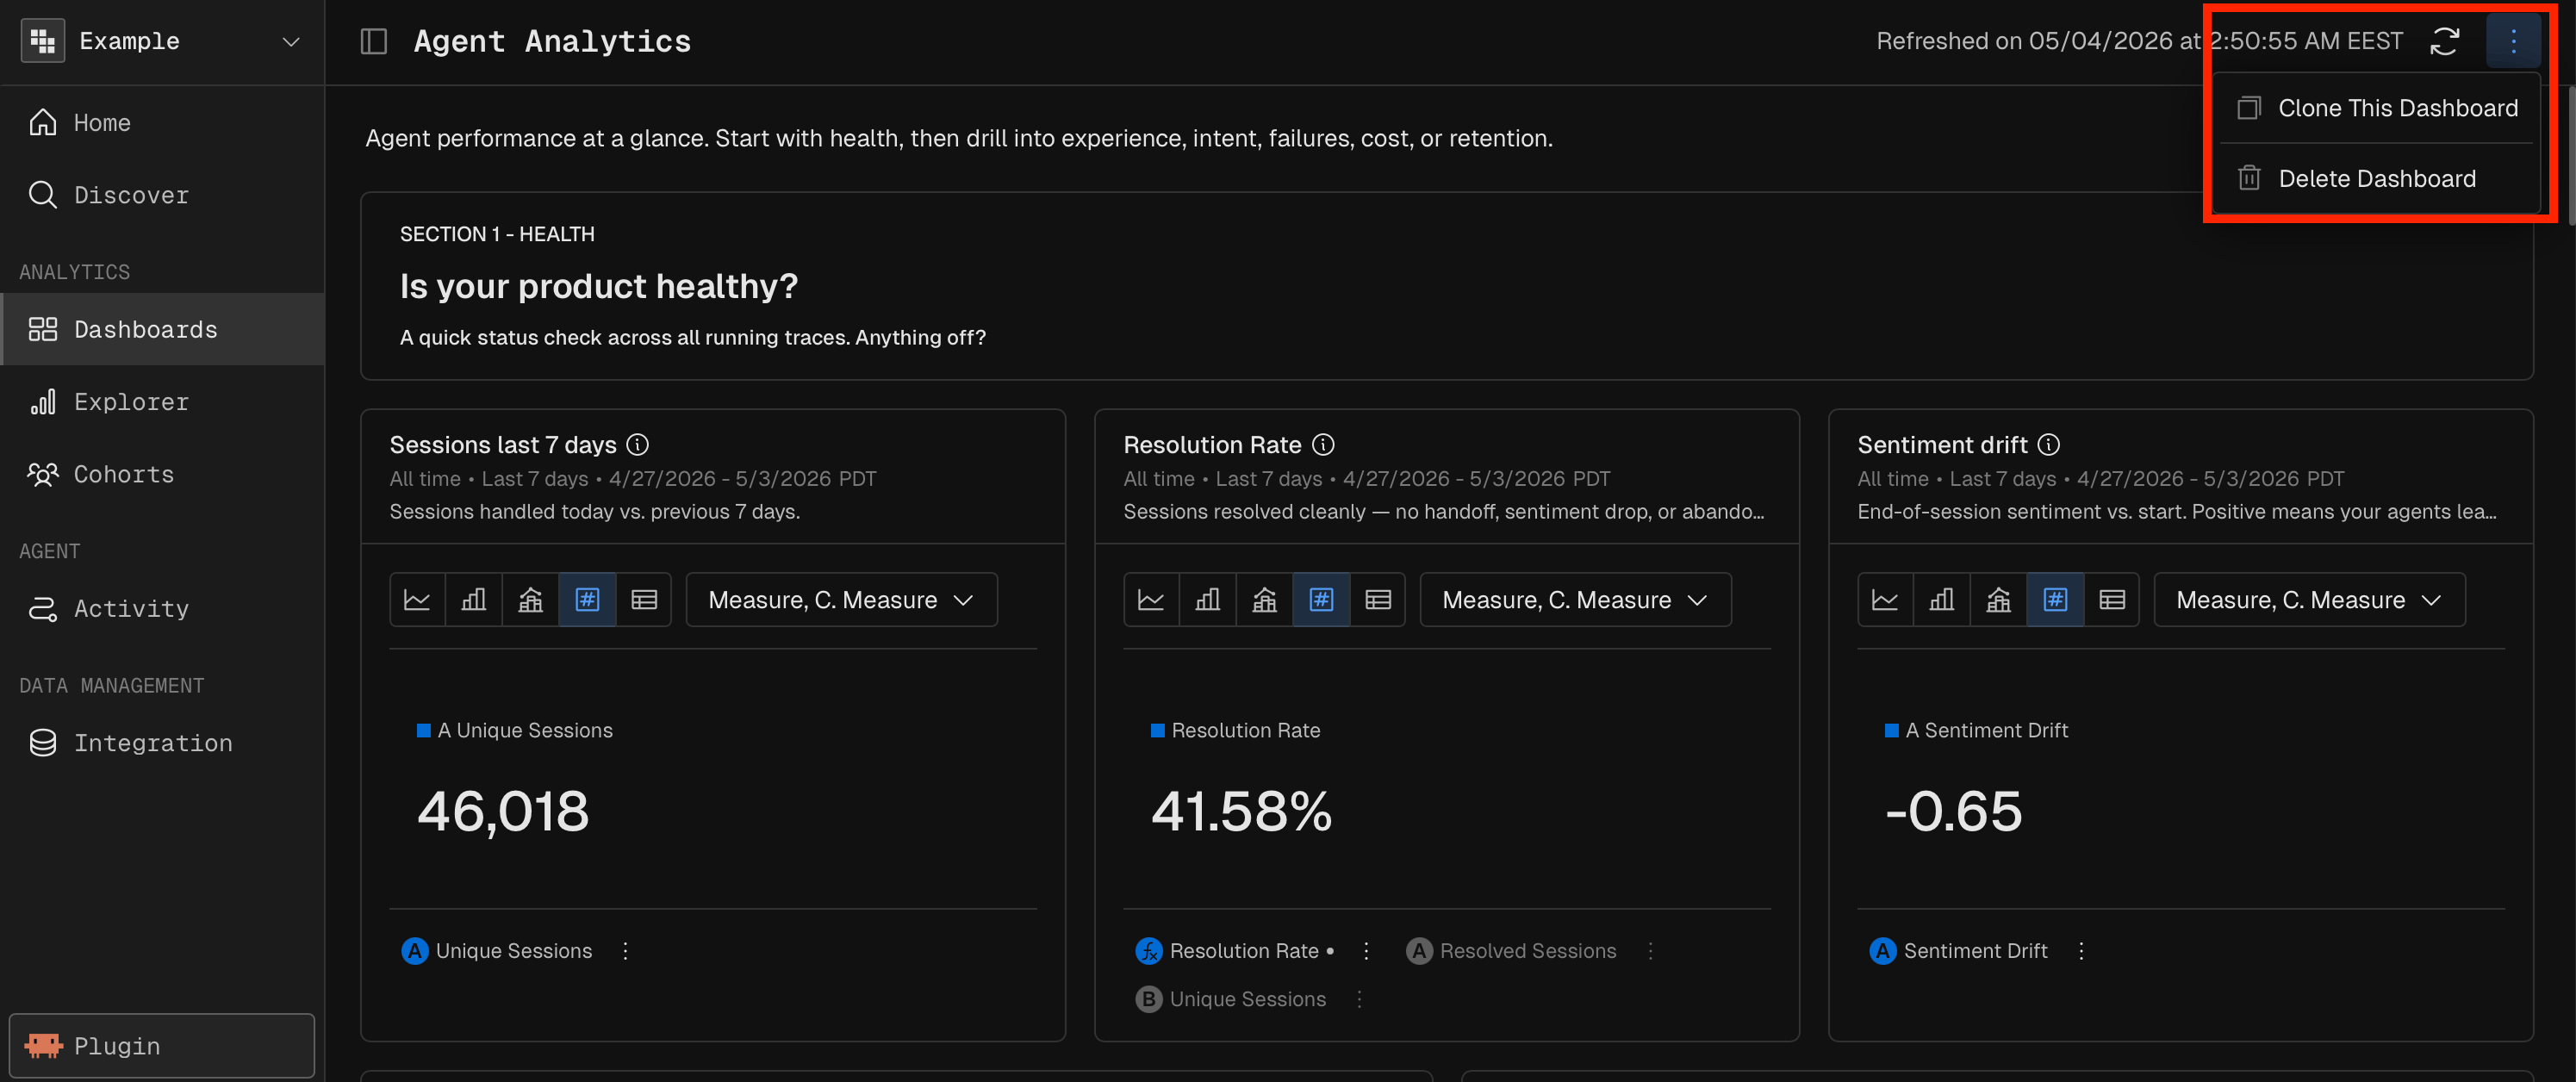
Refresh
Click the refresh icon in the dashboard header to run every report on the dashboard again. The header shows when the dashboard was last refreshed. When an incremental schedule is on, an alarm icon appears next to that time.Clone
Clone This Dashboard copies the whole dashboard: layout, reports and content. Enter a name and description for the copy. Kubit opens the copy when it’s created.Delete
Delete Dashboard removes the dashboard after you confirm. The confirmation warns that this can’t be undone. If you delete the dashboard you’re viewing, Kubit takes you back to the dashboard list.MCP prompt examples
“Clone the Support agent health dashboard as Support agent health (staging)“
Related
- Reports overview: the report types you can add to a dashboard.
- Lumos: drill into a chart.