

When to use
Pick the display by what you want to see:
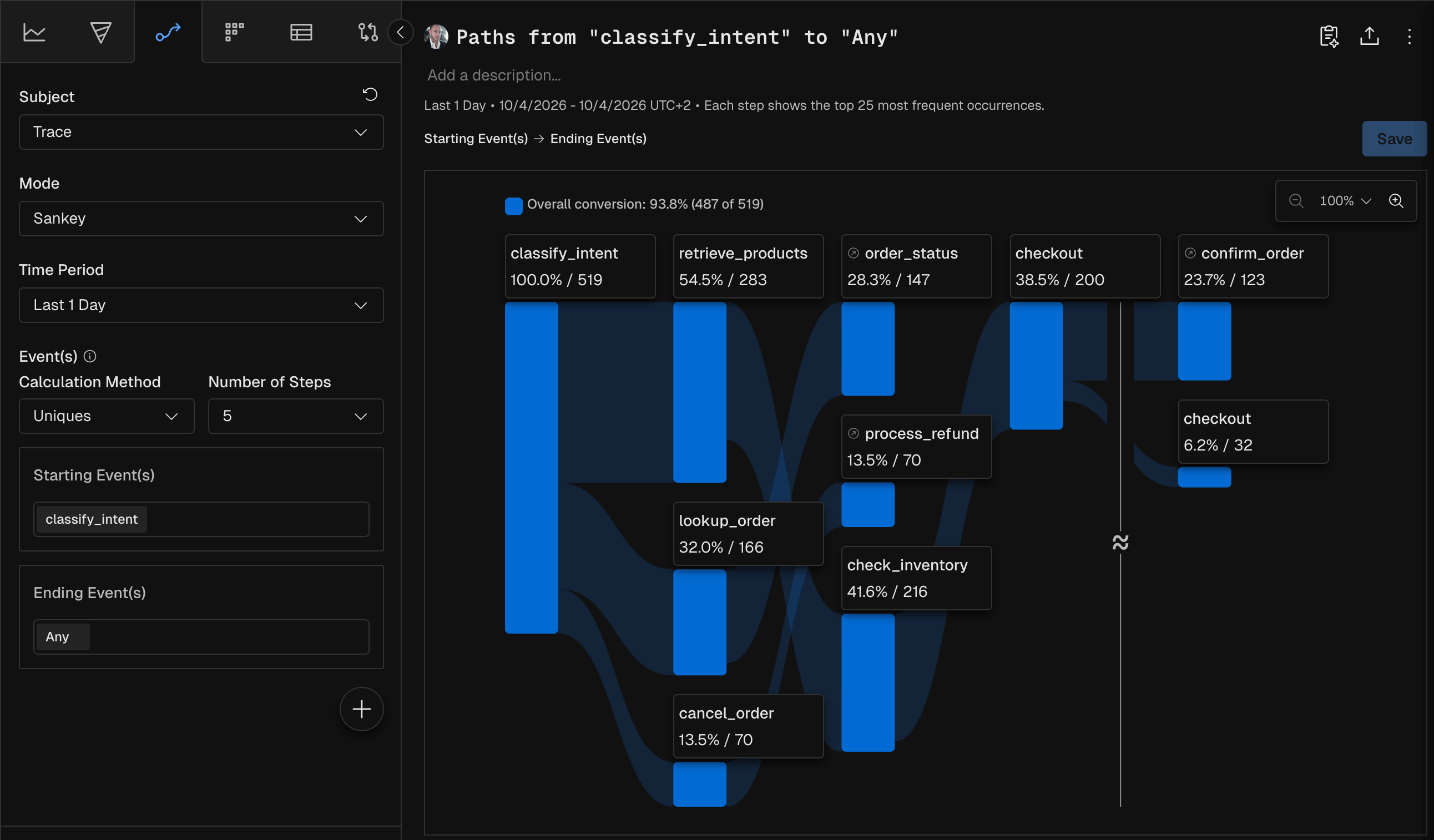
Subject
The subject is the entity whose path the report follows.Direction
Direction sets whether the path follows events forward or backward in time.
Availability: Top Paths mode only supports Forward.
Backward paths help with root-cause analysis. Start from an error or drop-off event and see the paths that led to it.
Events
Every path has a starting event and an ending event. They set where the journey starts and ends.
Each event can have property filters that narrow which occurrences count.
Number of steps
Number of Steps sets how many steps the path shows between the starting and ending events. More steps show more detailed paths. Fewer steps give an overview.Calculation method
The calculation method sets how subjects are counted at each step.
Use Uniques to count how many distinct users took a path. Use Totals to measure how much traffic goes through each path.
Display modes
A Path report has two display modes, set with Mode.Sankey
The Sankey diagram shows every branching and converging path as nodes and links. Each node is an event. A link’s width is the number of subjects moving between two events. The Sankey view supports merge, expand and fold adjustments (see Path adjustments). It shows two counts: the subjects that entered the path, and the subjects that reached the ending event.Top Paths
Top Paths is a ranked list of the most common end-to-end paths. Each path is drawn as a small funnel, with the exact sequence of events and the subject count at each step.Filters
Where you add a filter changes what it affects.
To keep a noisy event out of the path, add a report filter on event name, such as
Event Name != "noisy event".
Path adjustments
After the path runs, you can refine the Sankey diagram with adjustments. They appear under Path Adjustment(s) in the report builder once added, and only apply to the Sankey diagram.Additional settings
Group By
Group By applies only when the path has a breakdown.Partition
A conversion window works with the Day or None partitions. Don’t combine it with Partition: Day when its unit is days or longer.
Create a funnel from a path
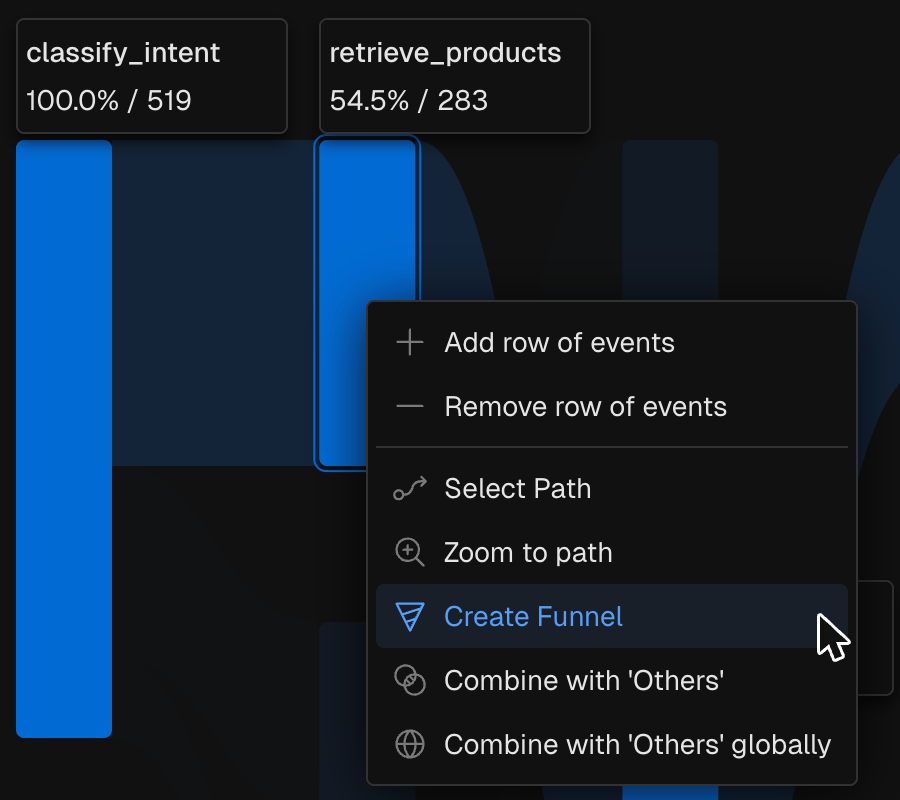
When one journey in a path stands out, turn it into a funnel to track its conversion rate over time.- Click the bar of the step where you want the funnel to end. A menu opens with Add row of events, Remove row of events, Select Path, Zoom to path, Create Funnel, Combine with ‘Others’ and Combine with ‘Others’ globally.
- Click Create Funnel.
Read the results
A Path report shows the top 25 occurrences at each step, which covers most of the paths subjects take. A subject that doesn’t perform one of the top 25 steps isn’t shown or counted.Main nodes
The main nodes are the blue boxes at each step. Each shows the percentage of subjects that performed that event as their Nth step, and the count from the calculation method (Uniques or Totals). The percentages in each step add up to about 100%, give or take rounding.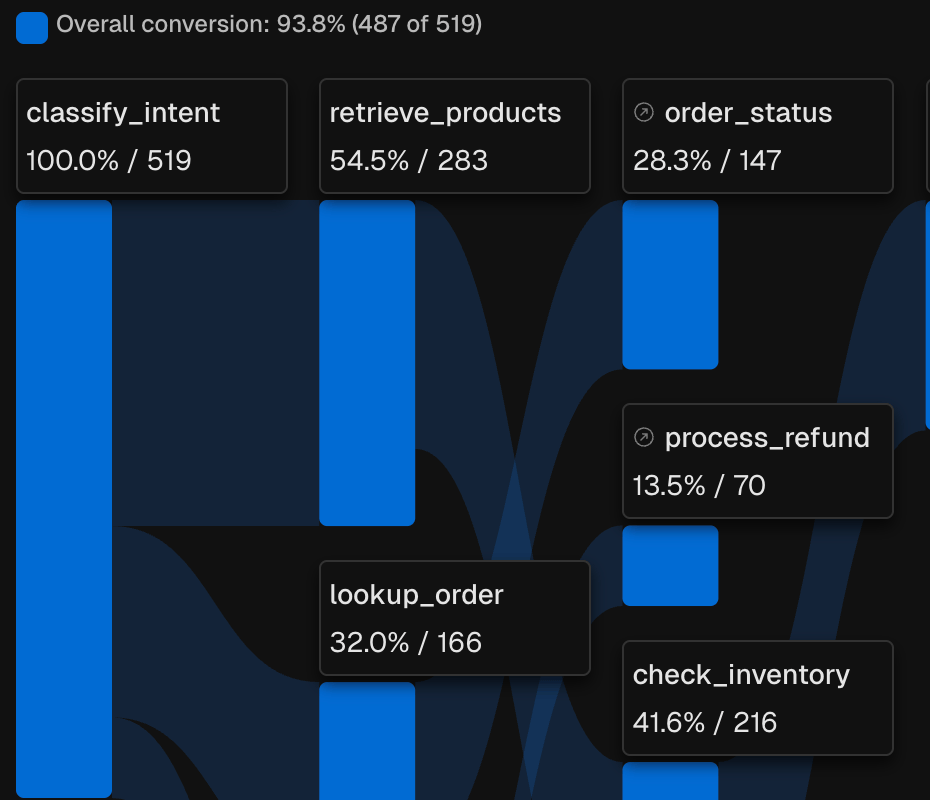
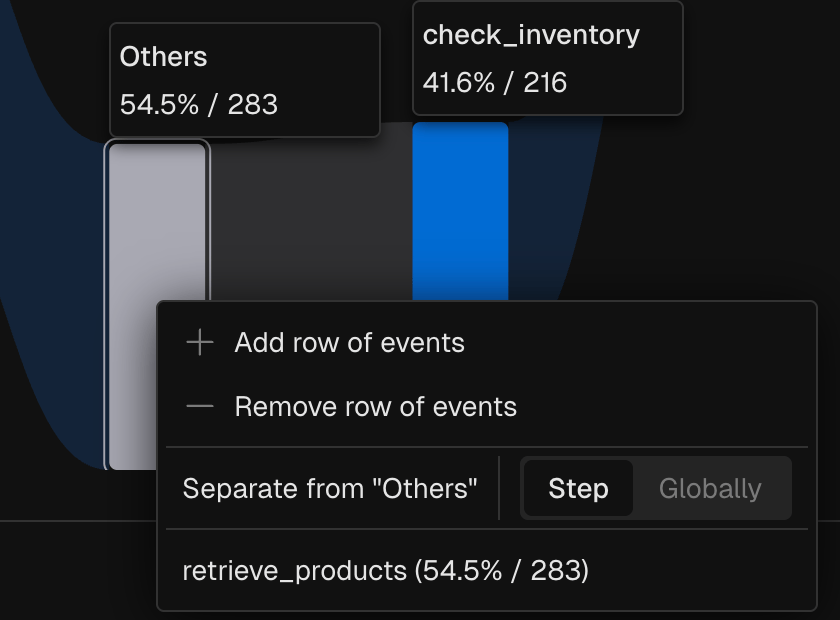
Others node
Main nodes are events with a large number of subjects. Less common events are grouped into anOthers node. Click the Others node’s bar to open its menu. Click Add row of events, or pick an event in the list to separate it from Others, at this step only (Step) or at every step (Globally).
Drop Off node
The Drop Off node shows the percentage and number of subjects that performed no more events after the previous step. Read it as subjects that left the experience. It’s the solid black node at the bottom of each step. A final Drop Off node under the last conversion event counts subjects that never reached the ending event in the path’s time frame. A step with no Drop Off node lost no subjects. This happens, but rarely, since users can leave at any time.Prompt Kubit through the MCP server
With the Kubit MCP server connected, you describe the starting or ending event and the journey you want to see, and the server builds the path. A good path prompt names:MCP prompt examples
“Show me a path from user prompt over the last 7 days”
“What events lead to a checkout error? Show me a backward path to ‘checkout_error’, broken down by platform”
“Create a forward path from intent classification with 6 steps, counting unique traces, for the last 30 days”
“List the top paths users take from search to purchase over the last 14 days”
How the server reads a prompt
A Path report doesn’t support Compare. To look at two time periods, filter each one by date range instead.
Related
- Funnel report: track the conversion rate of a path you found here.
- Filters: how report filters work.
- Reports overview: the other report types.