

When to use
Number formatting
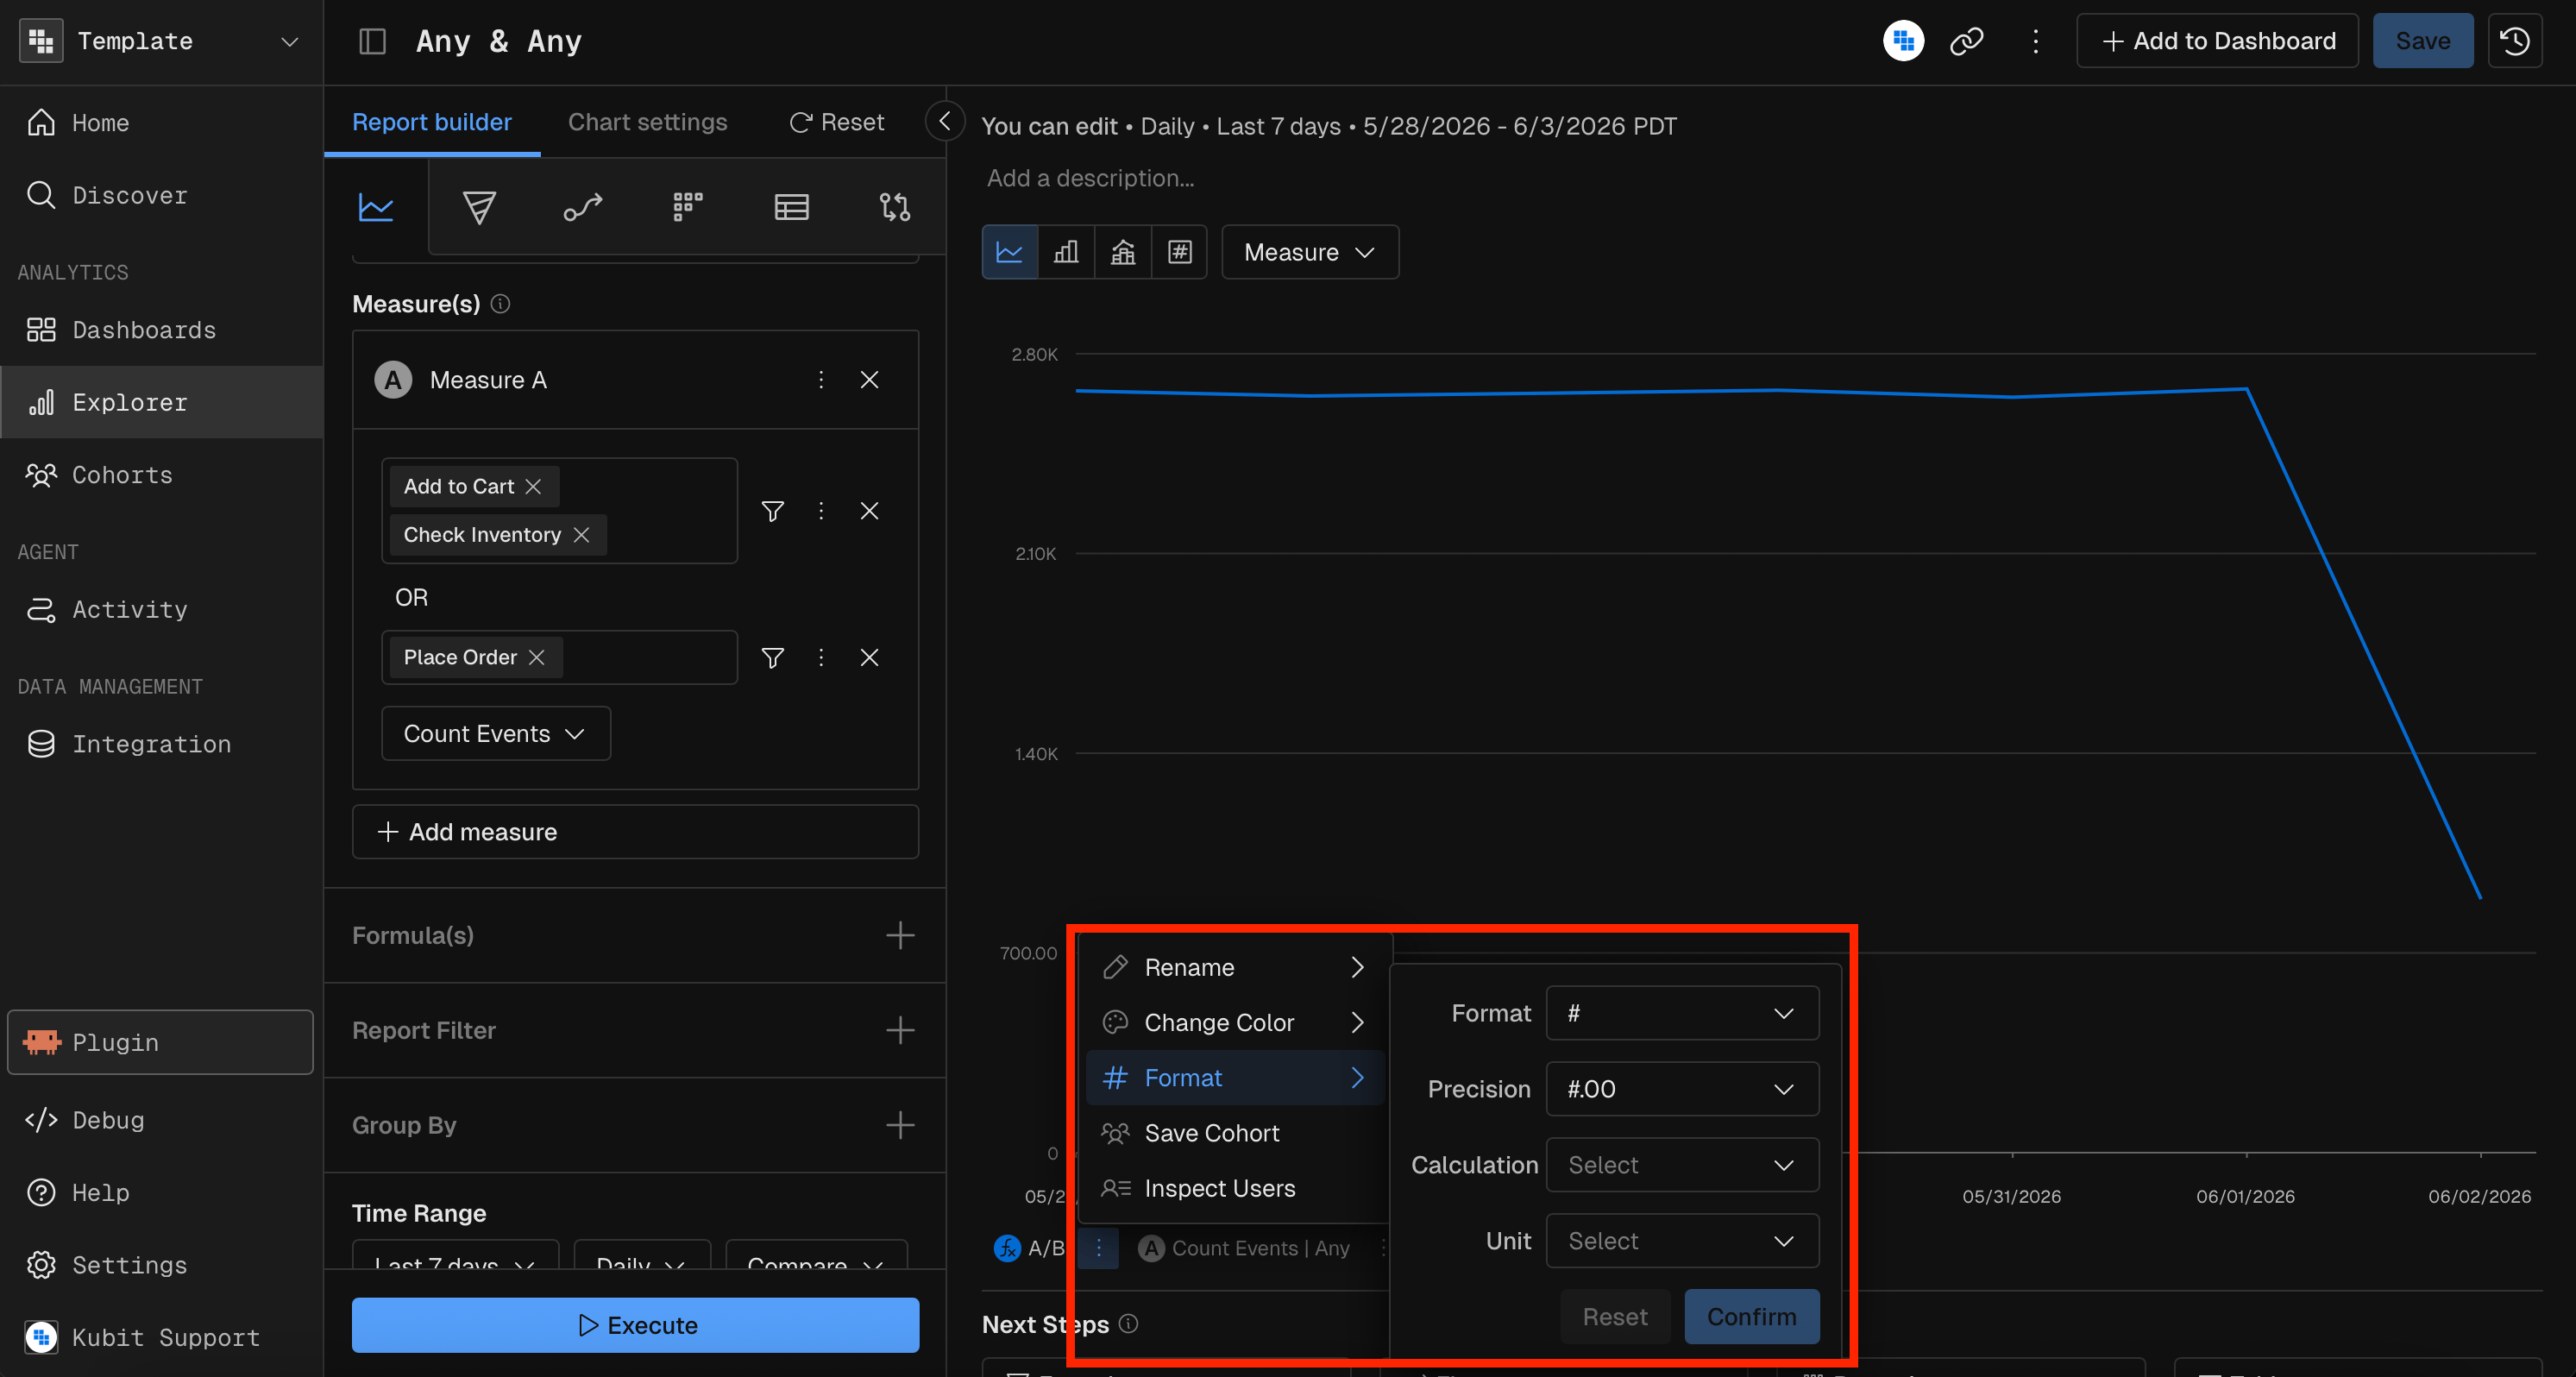
Number formatting (Measure Display Format) controls how a measure’s values appear in the chart and the table.
For example, to show a value stored in milliseconds as seconds with 2 decimal places, set Format Kind to Number, Calculation to divide by 1000, Decimal Places to 2 and Unit Label to Seconds.
In the screenshot, the format settings open from a measure’s options menu (the three-dot icon next to the measure in the legend) under Format, with the fields Format, Precision, Calculation and Unit.
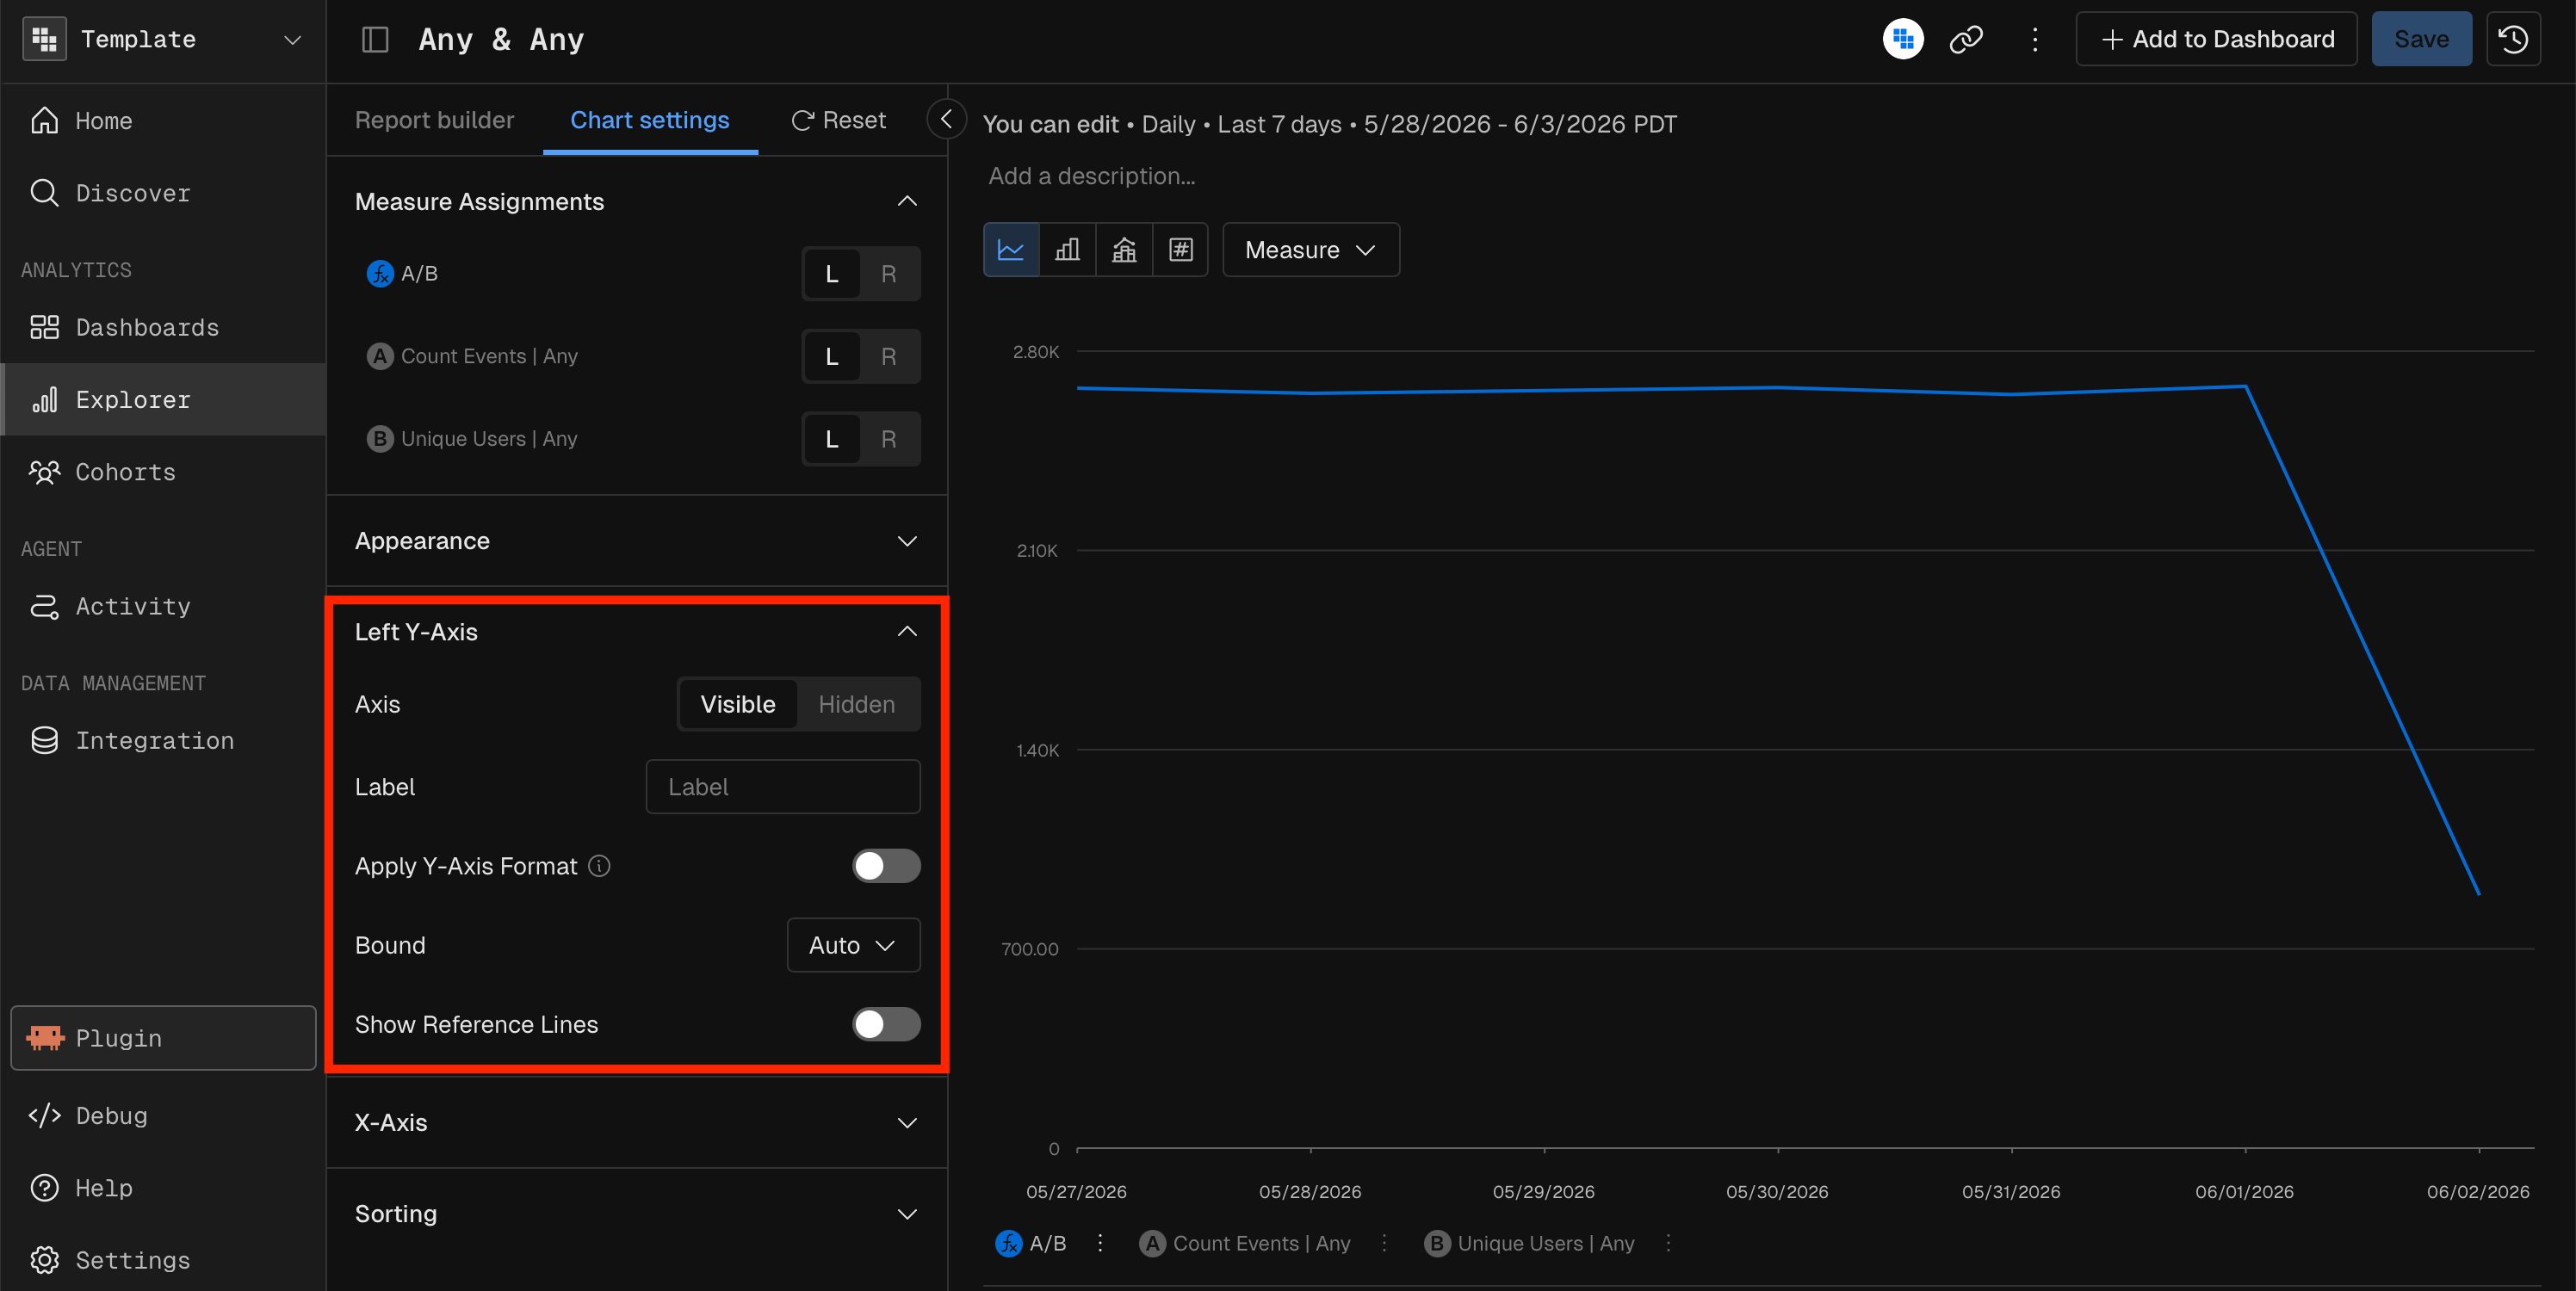
Y-axis
X-axis
Line and point styles
These settings apply to Line and Combo charts.Gridlines
Reference lines
Reference lines are horizontal lines that mark a threshold or target. Each axis takes up to 5 reference lines.Pie chart settings
Stacked chart settings
Rolling and cumulative calculations
Rolling and cumulative calculations smooth or accumulate values over a time window.
Advanced Query analysis covers rolling measures, which apply a rolling window to the measure itself.
Sorting
Show rank
With a Group By active, turn on Show Rank to show a rank number (1st, 2nd, 3rd and so on) next to each breakdown value, ordered by measure value.MCP prompt examples
Availability: chart settings are applied in the Kubit app after a report is built. They can’t be set through the MCP server.“Show me a line chart of daily revenue with a 7-day moving average, smoothed curves, and a reference line at 10,000”
“Create a 100% stacked bar chart of events by category over the last 14 days”
“Build a KPI showing average response time in seconds (the raw value is in milliseconds)“
Related
- Chart types: which settings apply to which chart.
- Data table view: the table below the chart, and hiding series.