

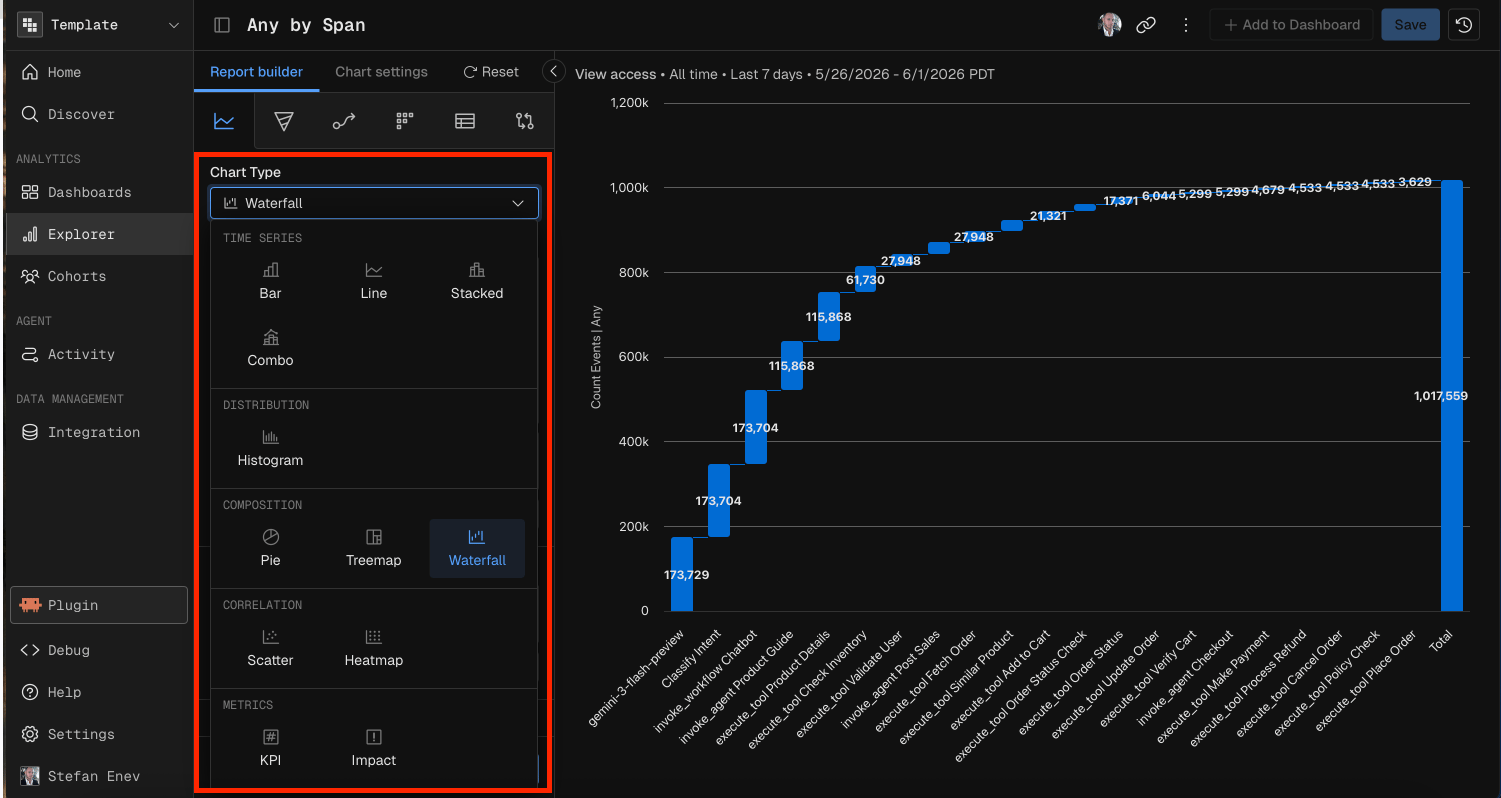
When to use
Common parameters
Every chart type needs these parameters.
Filters and Sampling cover the optional parameters in detail.
Time Series charts
Time Series charts plot data over time. They support the time units Hour, Day, Week, Month, Quarter and Year, plus All Time.Bar
A Bar chart shows values as vertical bars over time periods. Use it to compare discrete time buckets.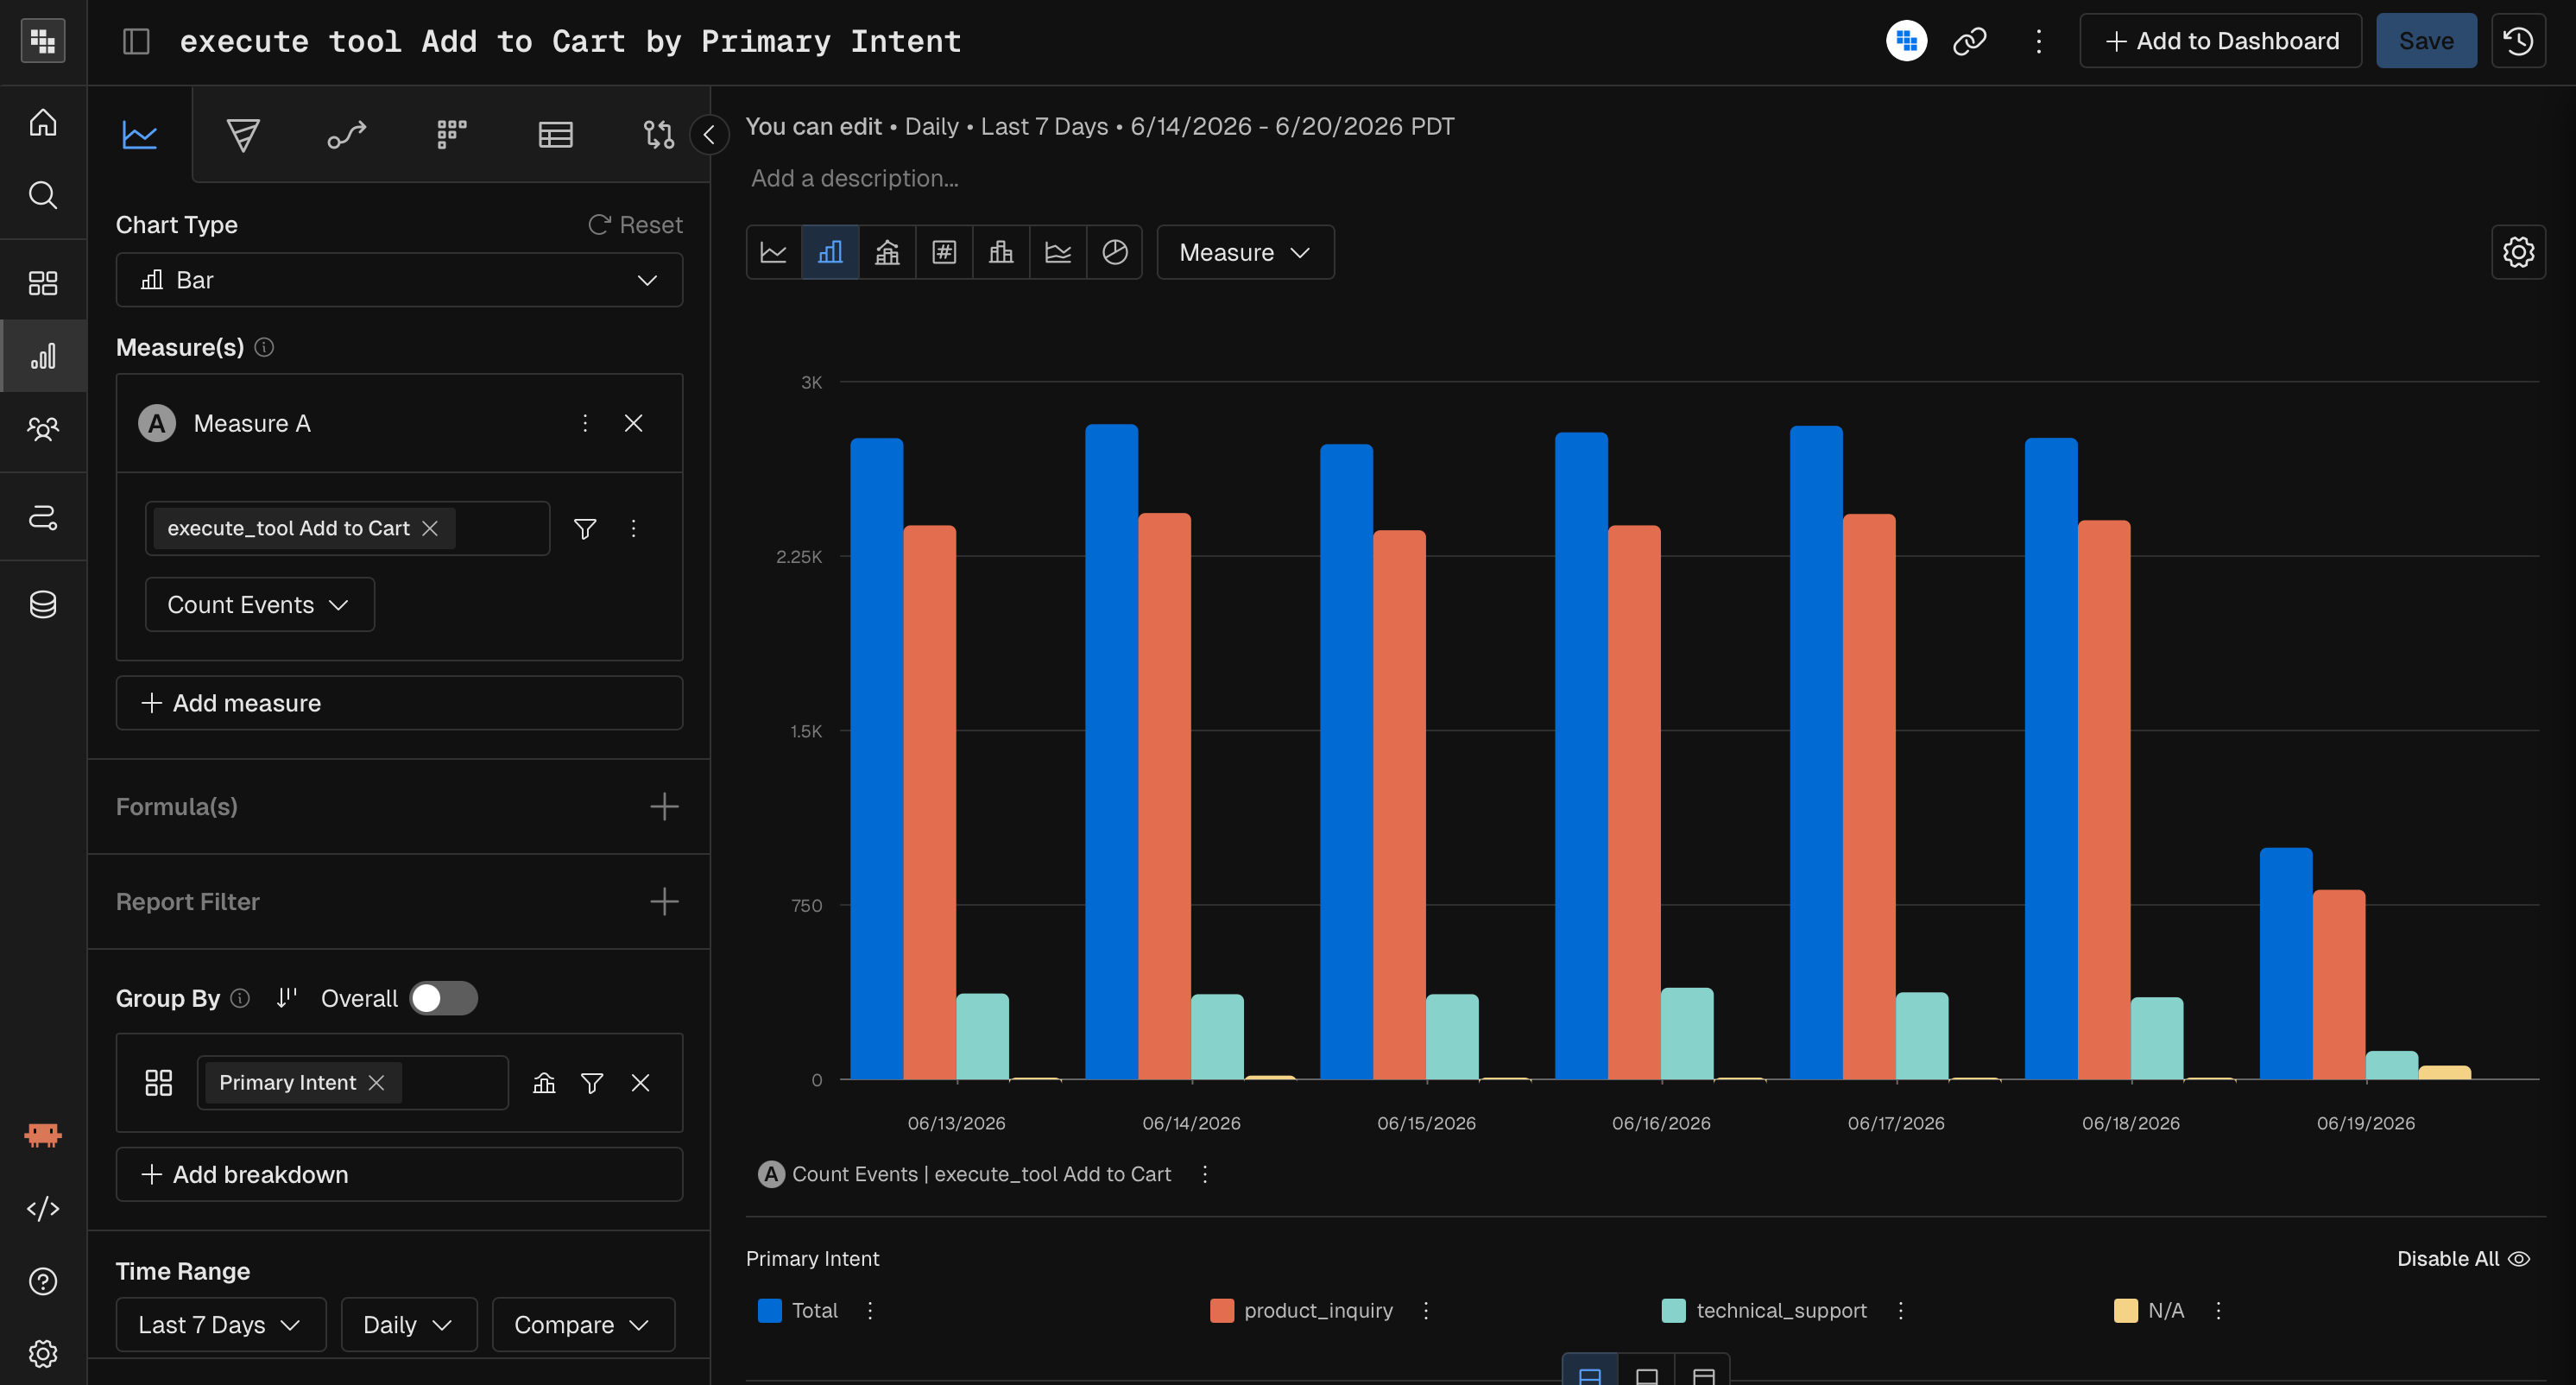
Line
A Line chart connects data points over time. Use it to spot trends across continuous time periods.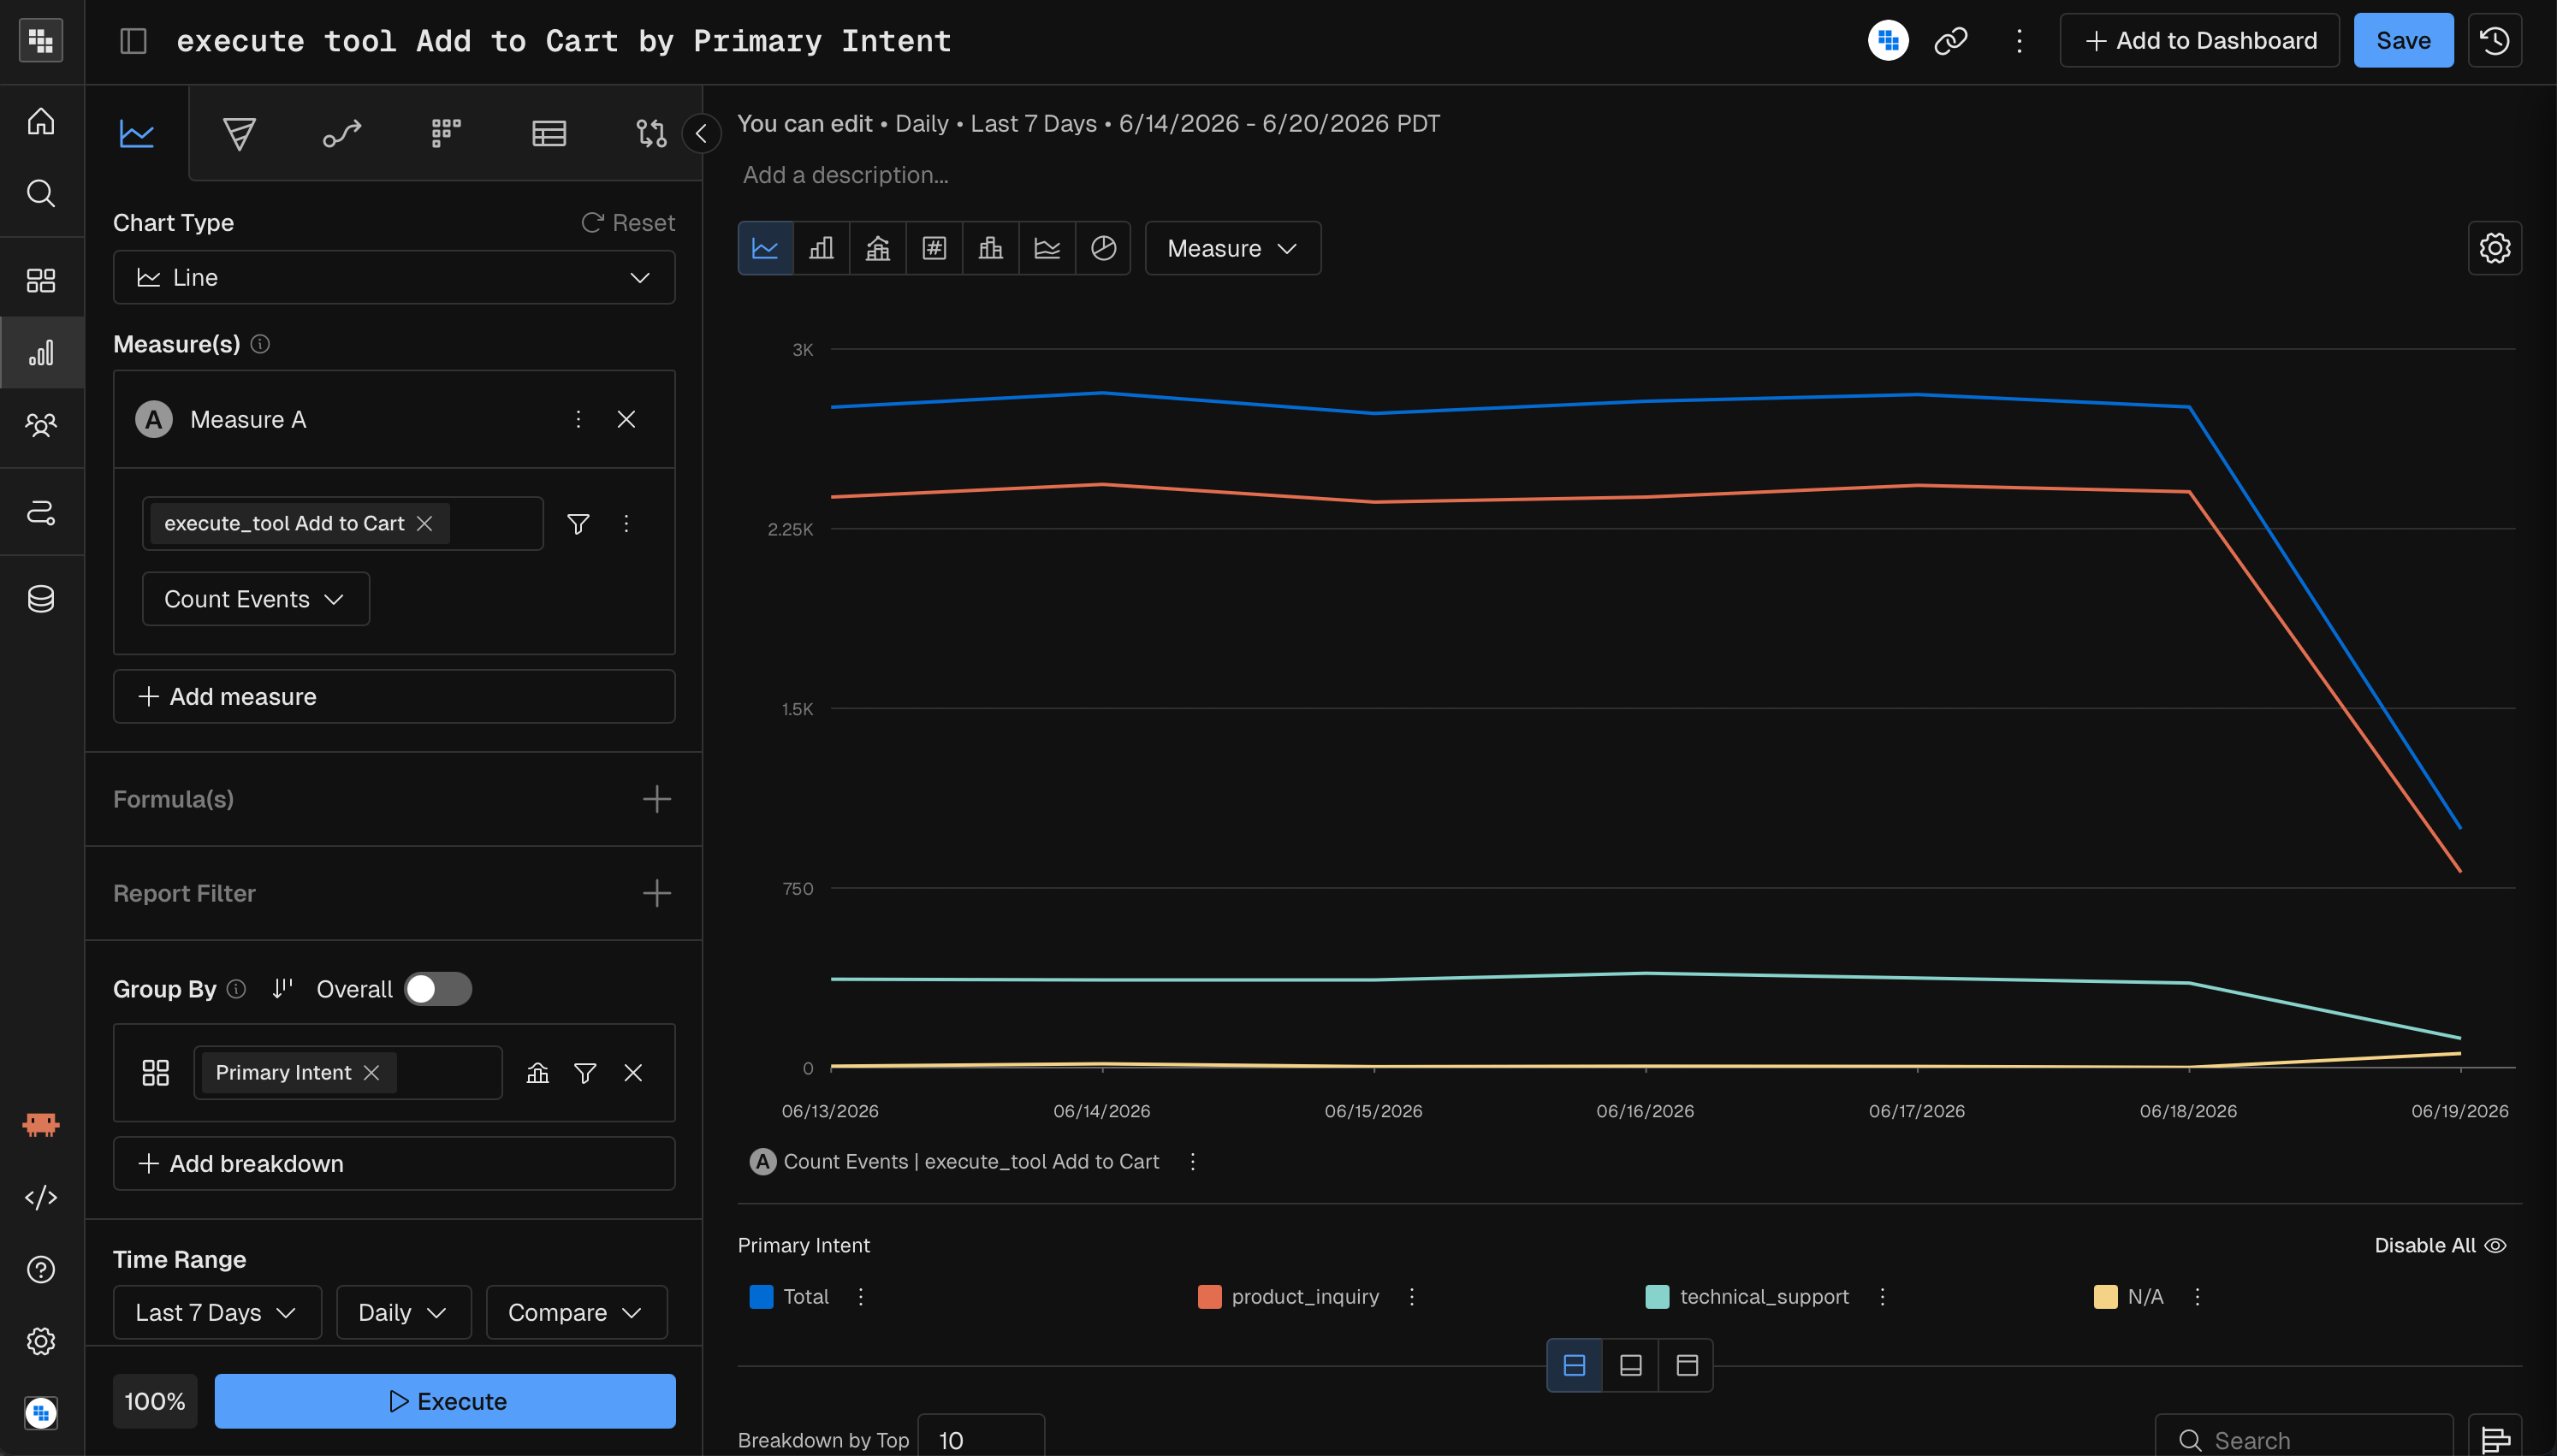
Stacked
A Stacked chart divides each column into segments by a breakdown dimension. Use it to show part-to-whole relationships over time.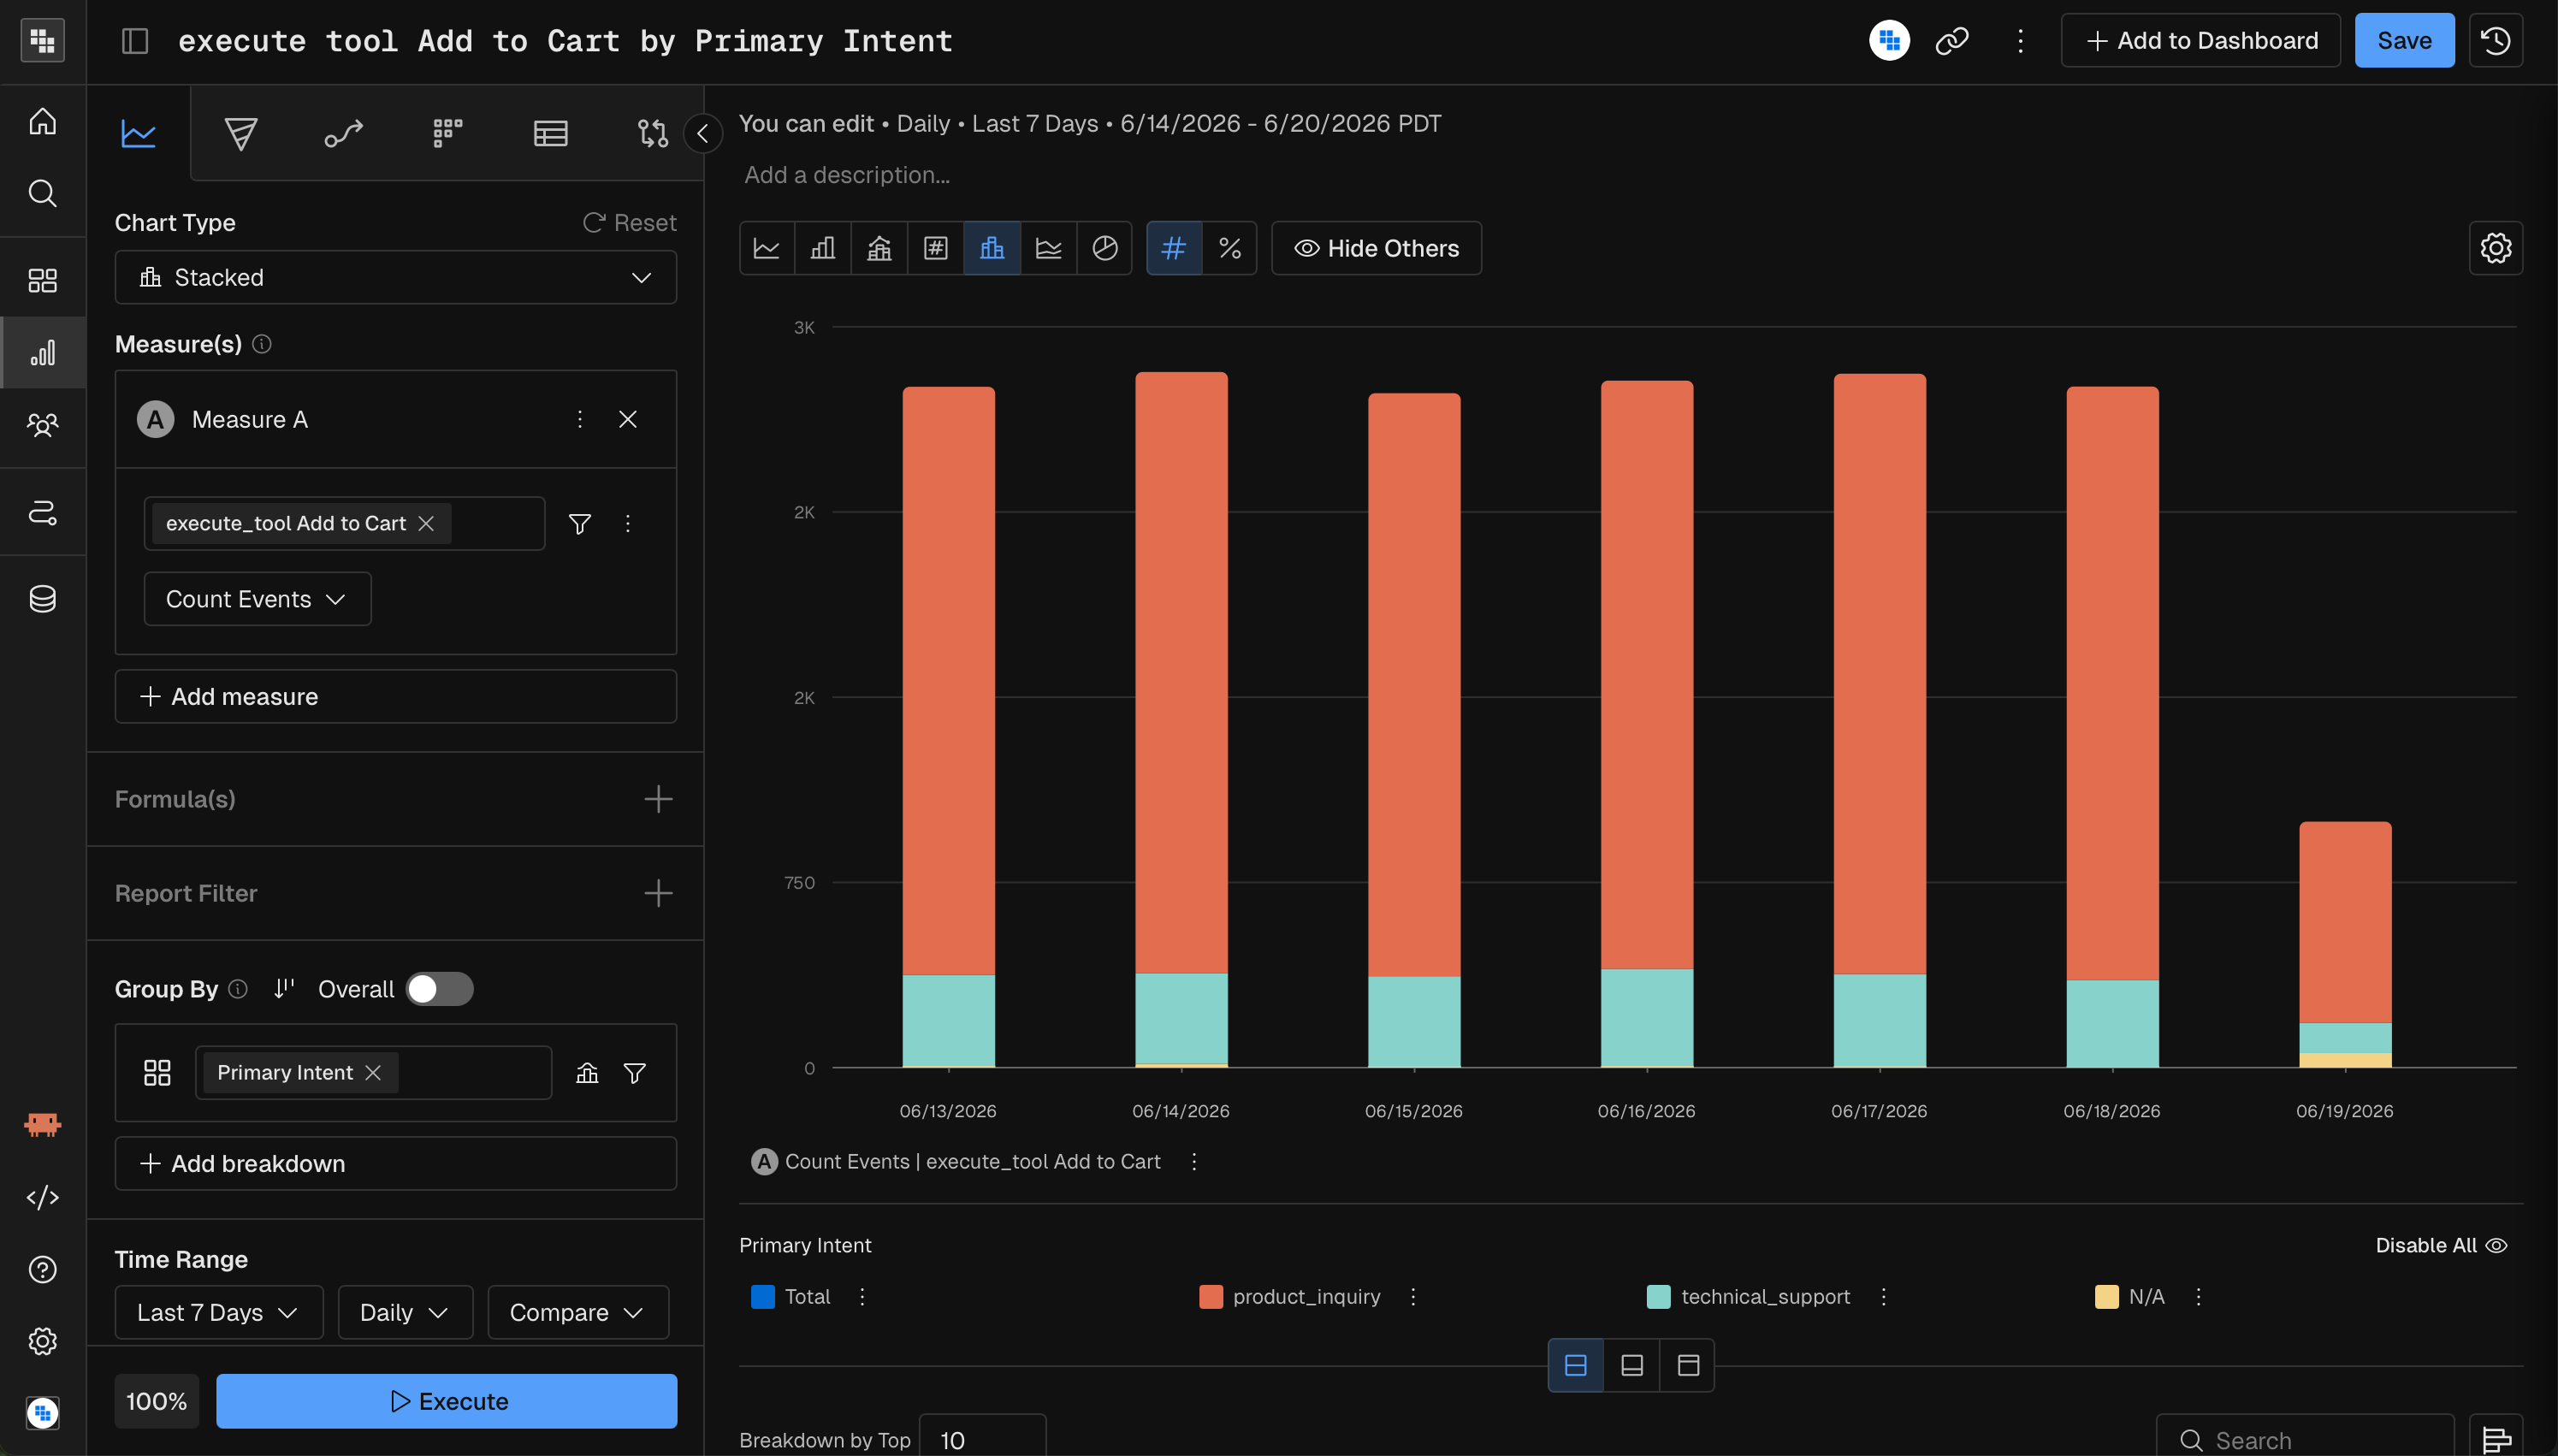
Combo
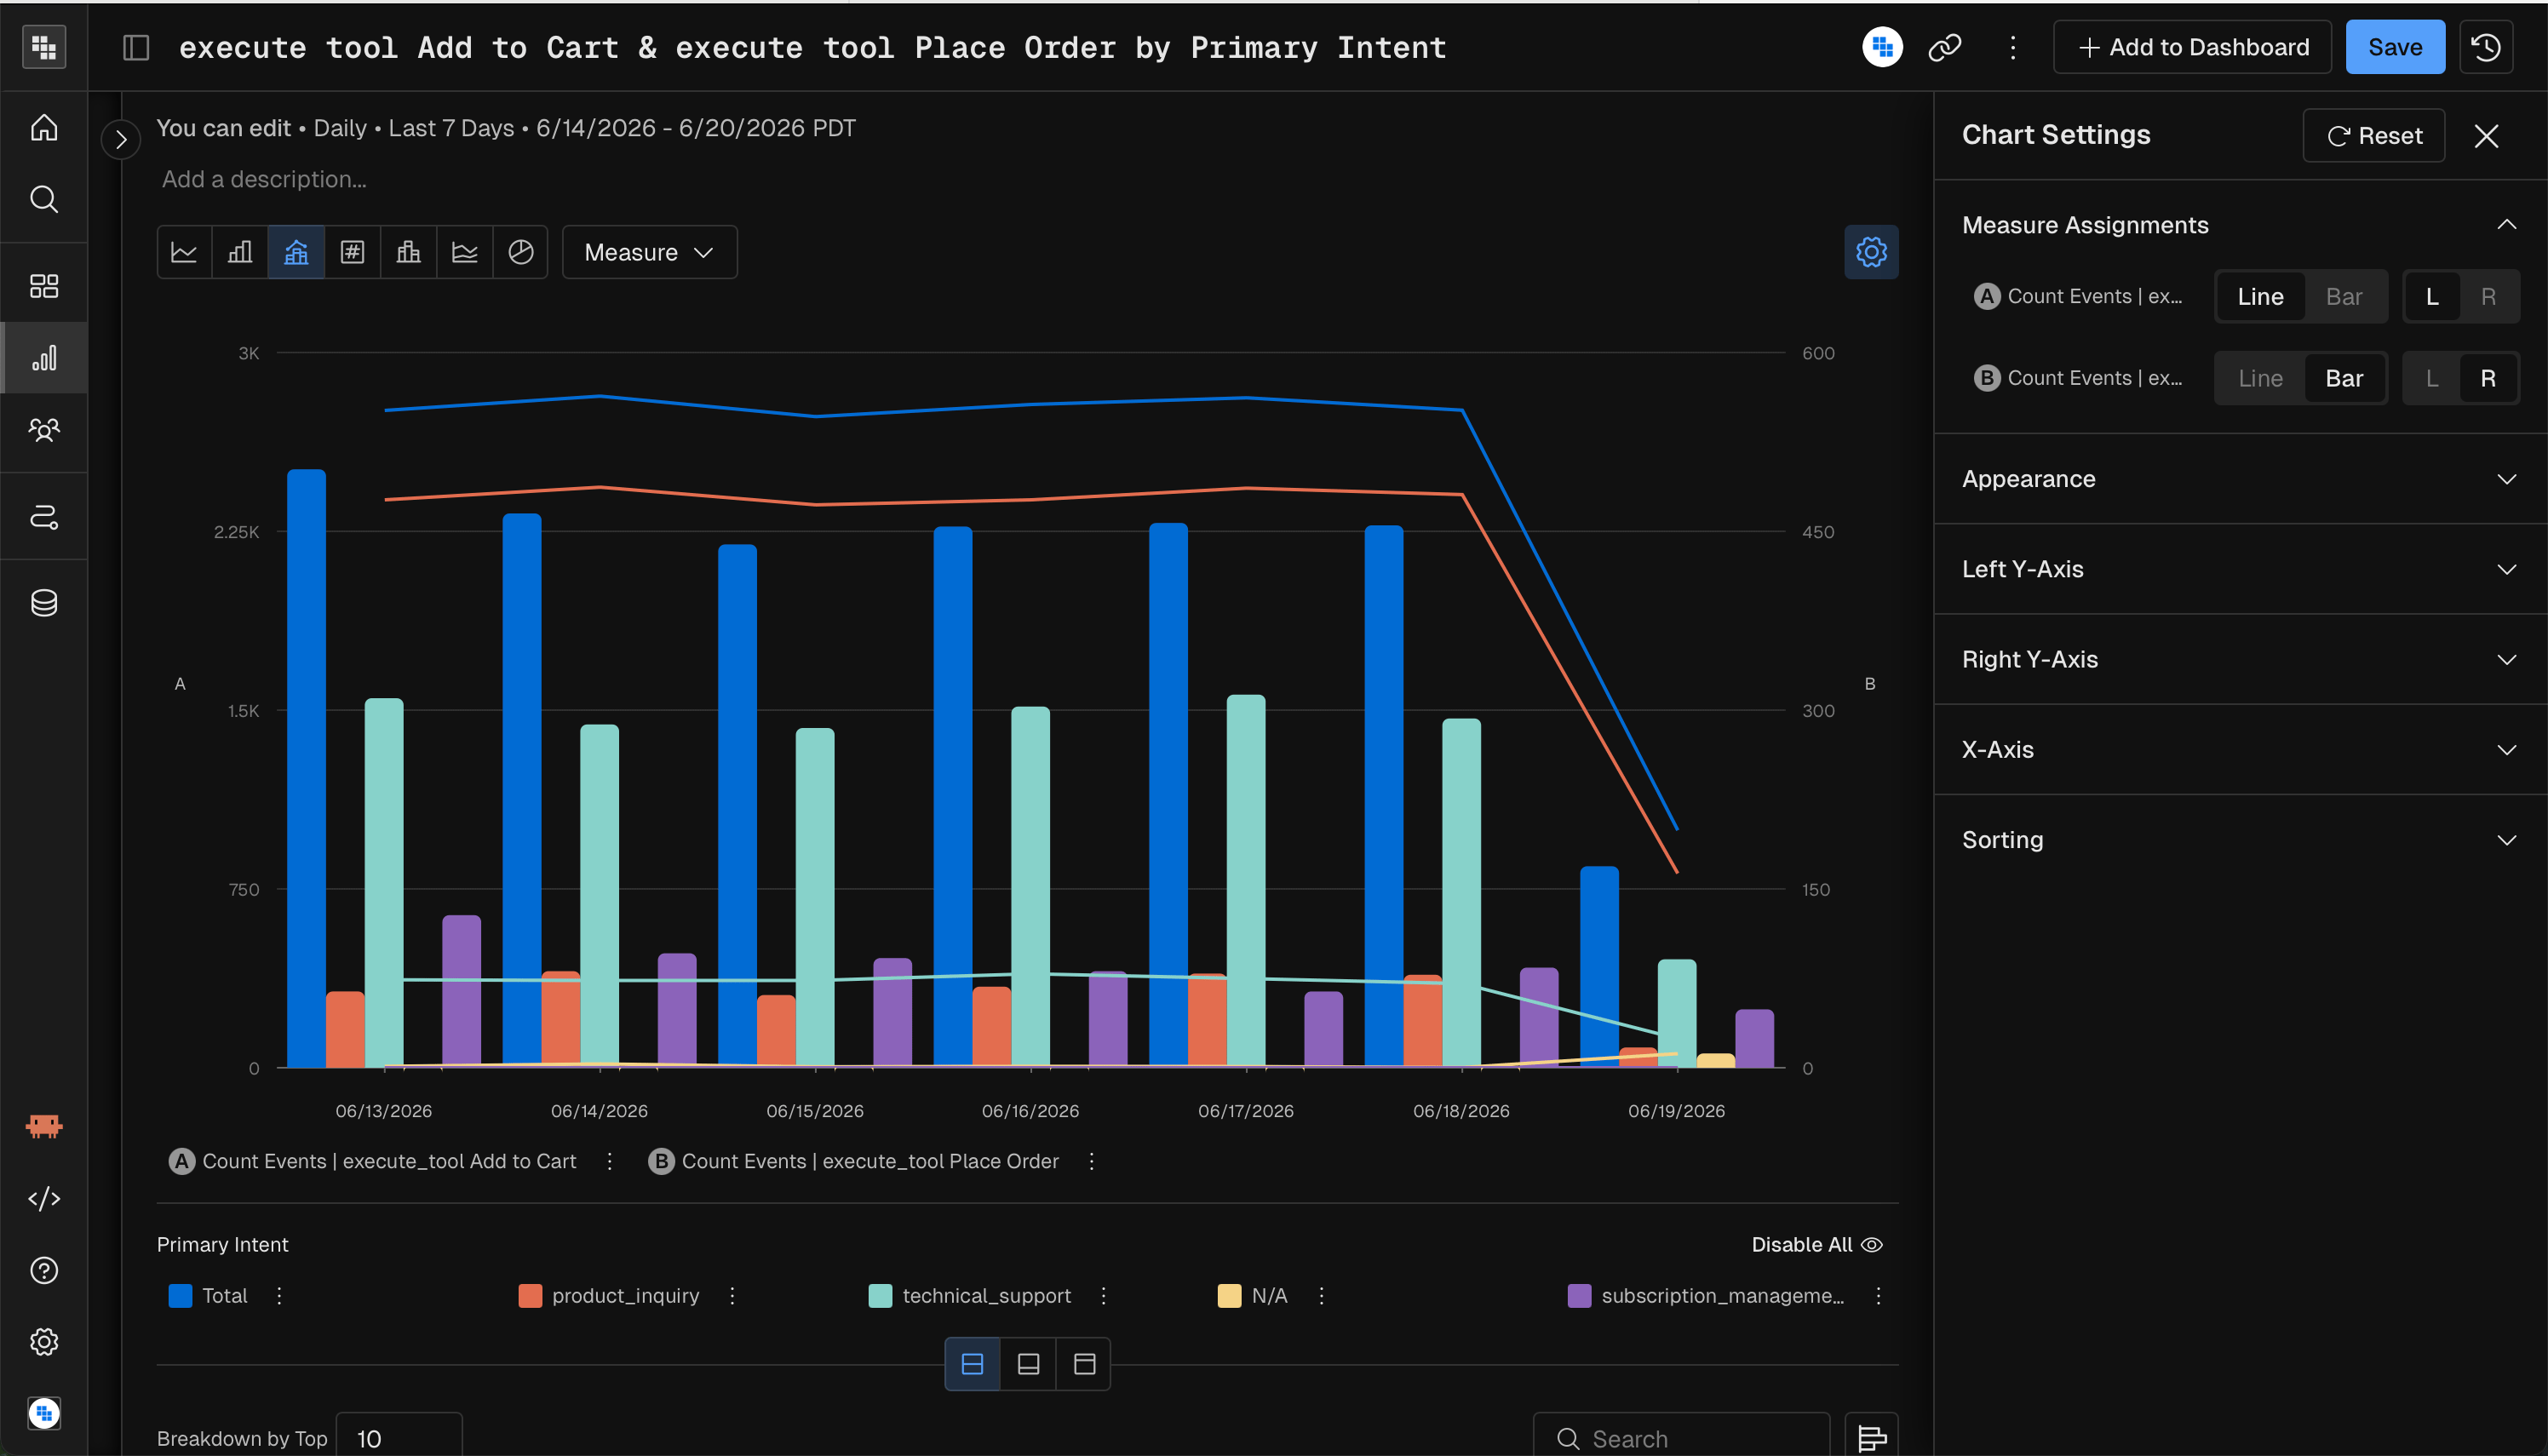
A Combo chart overlays bars and lines on the same time axis. Use it to compare two measures with different scales, such as revenue as bars and conversion rate as a line.
Set which measure is a line or bars, and which Y-axis it uses, under Measure Assignments in Chart Settings.
Distribution charts
Histogram
A Histogram shows how a measure’s values spread across buckets. Use it for questions like “How are session durations distributed?”Build a Histogram
- Set the chart type in Query to Histogram.
- Build the measure you want to analyze. Typically this is Sum, a count of events, or a compound measure such as a percentage per user.
- Select the subject to analyze. The subject is what gets counted, the thing that performs the measure from step 2.
- Choose the count subject on the Y-axis.
- Choose the Group By on the X-axis. This sets the bins. Use a pre-built range if it fits, or create a custom one. Base the range on the values you expect from your measure. If a user can do an action at most 10 times a day, the range’s maximum is likely 10.
- Apply any filters you need.
- Select the date range.
- Click Execute.
Composition charts
Pie
A Pie chart shows the proportions of a measure across a few categories. Use it for a quick part-to-whole snapshot.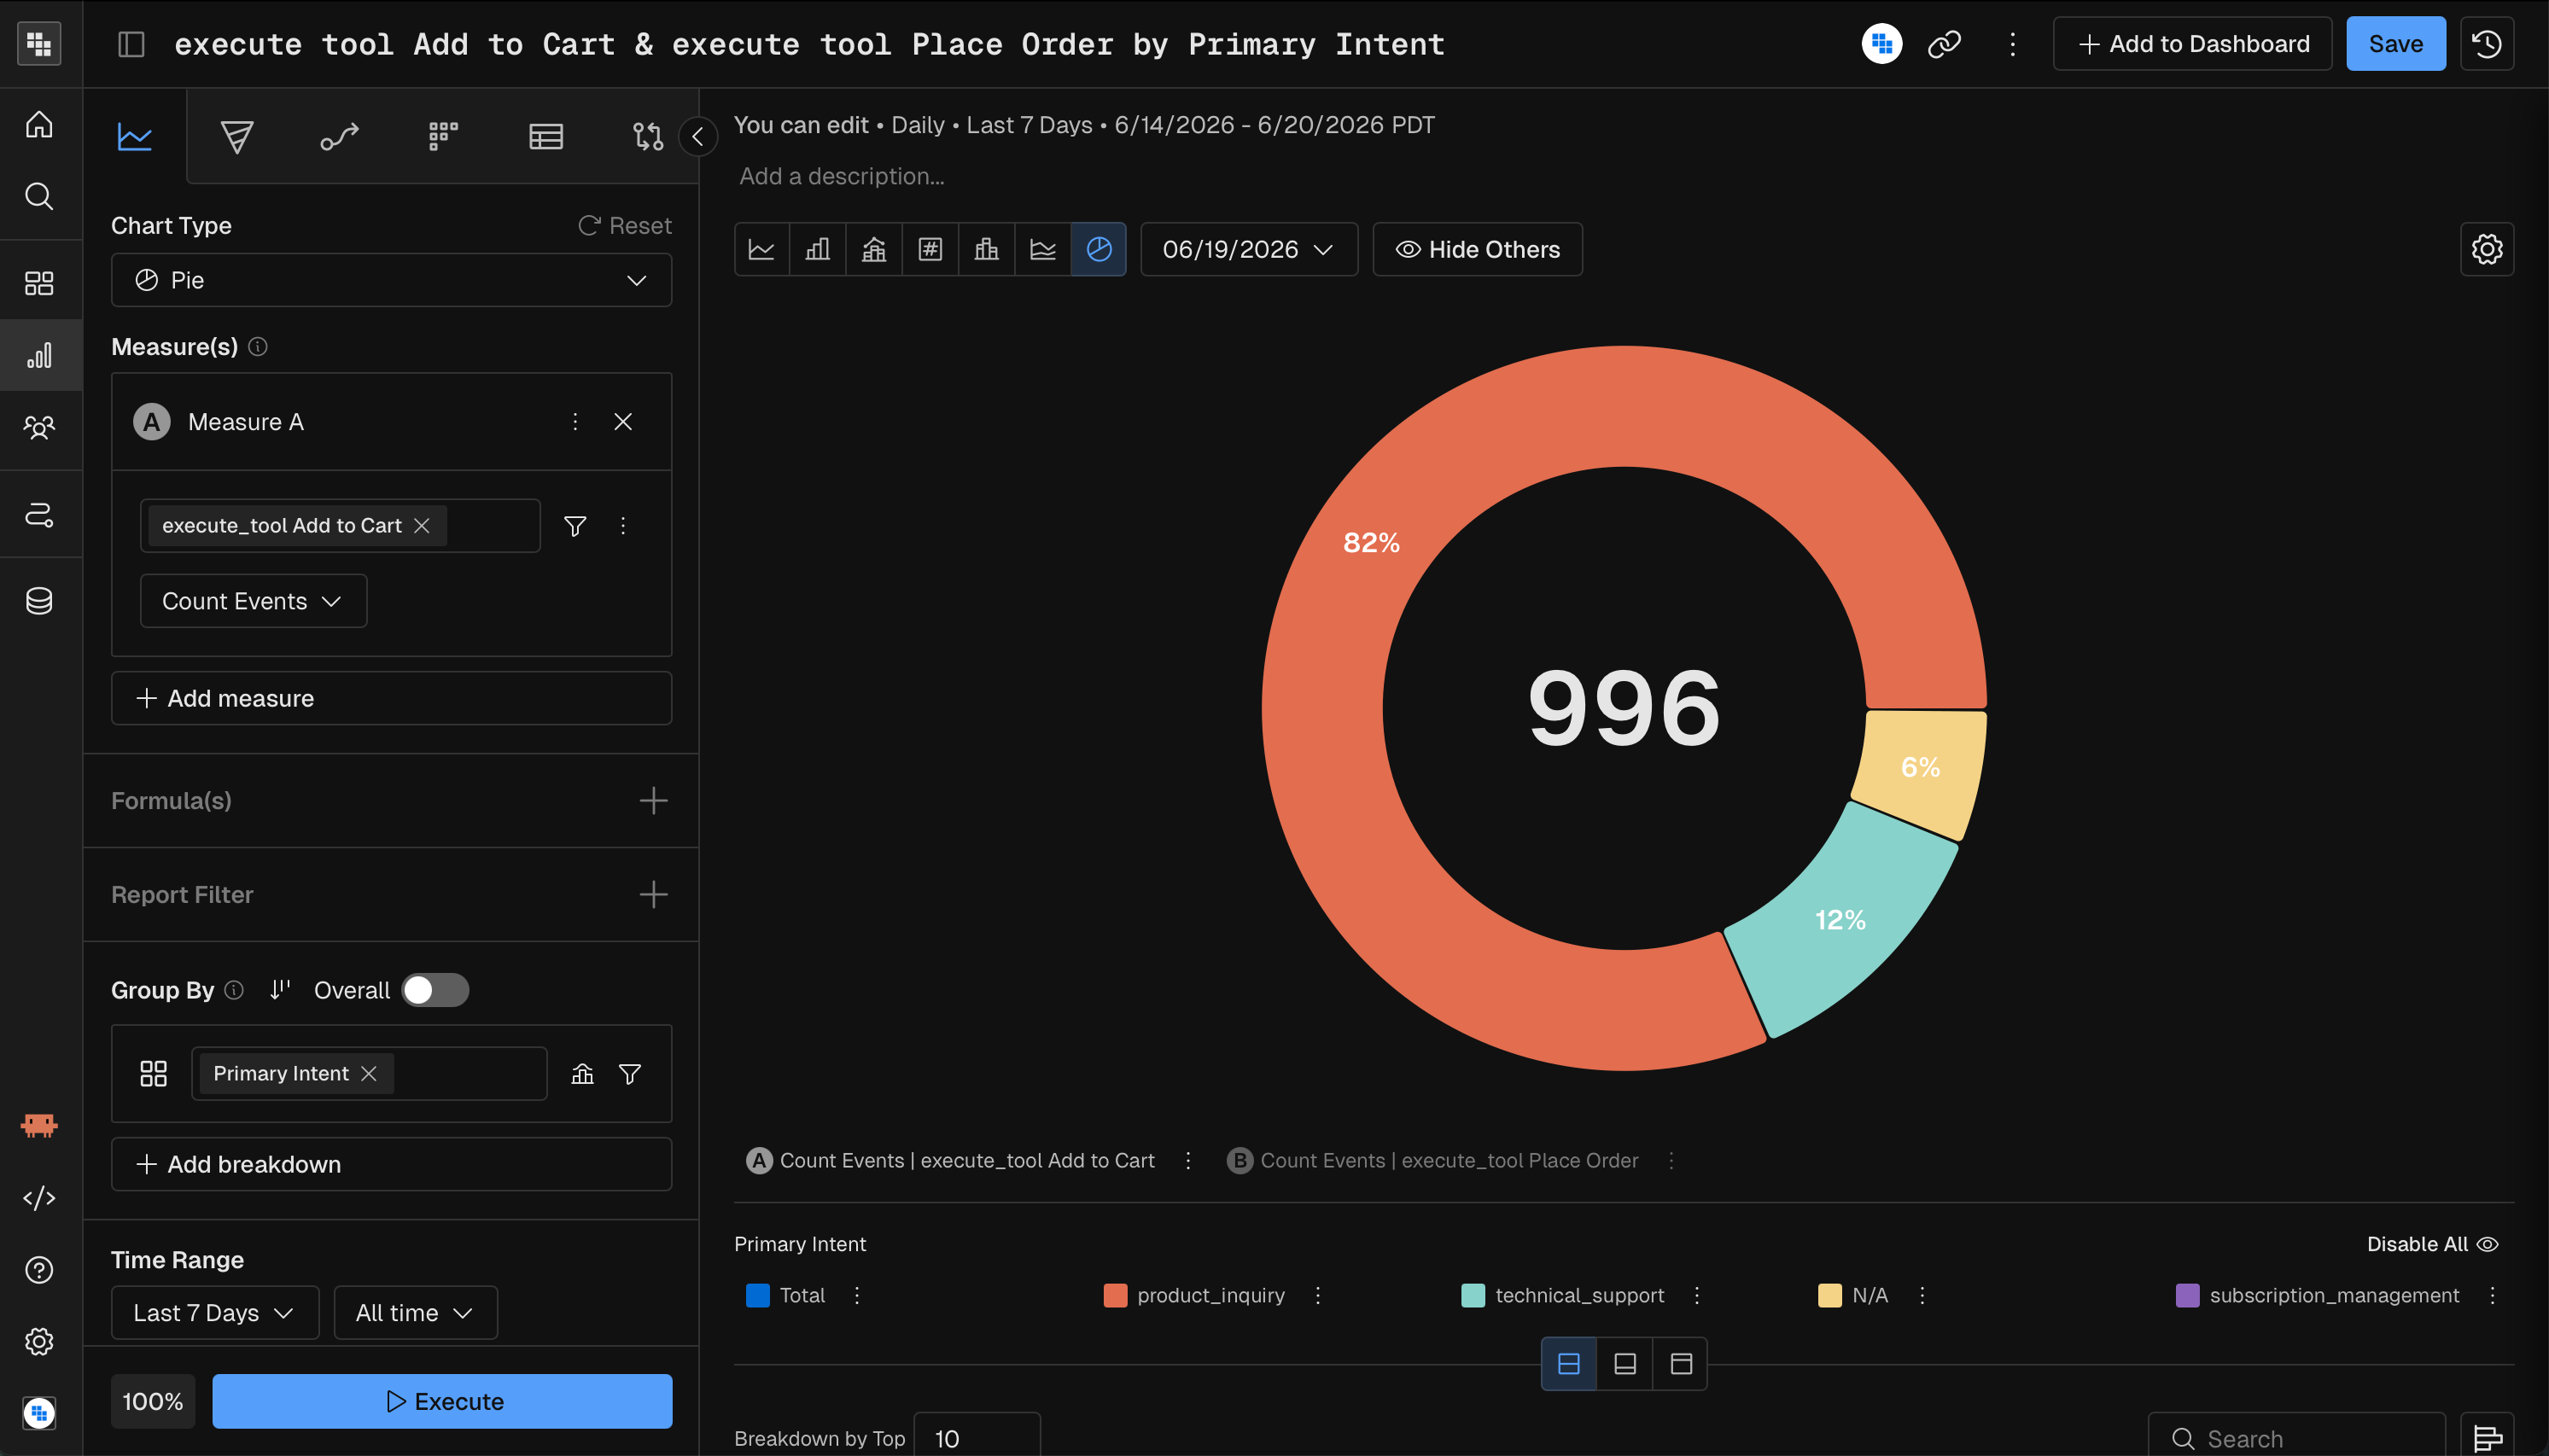
Treemap
A Treemap shows proportions as nested rectangles. Use it to compare relative sizes across many categories, especially with hierarchical breakdowns.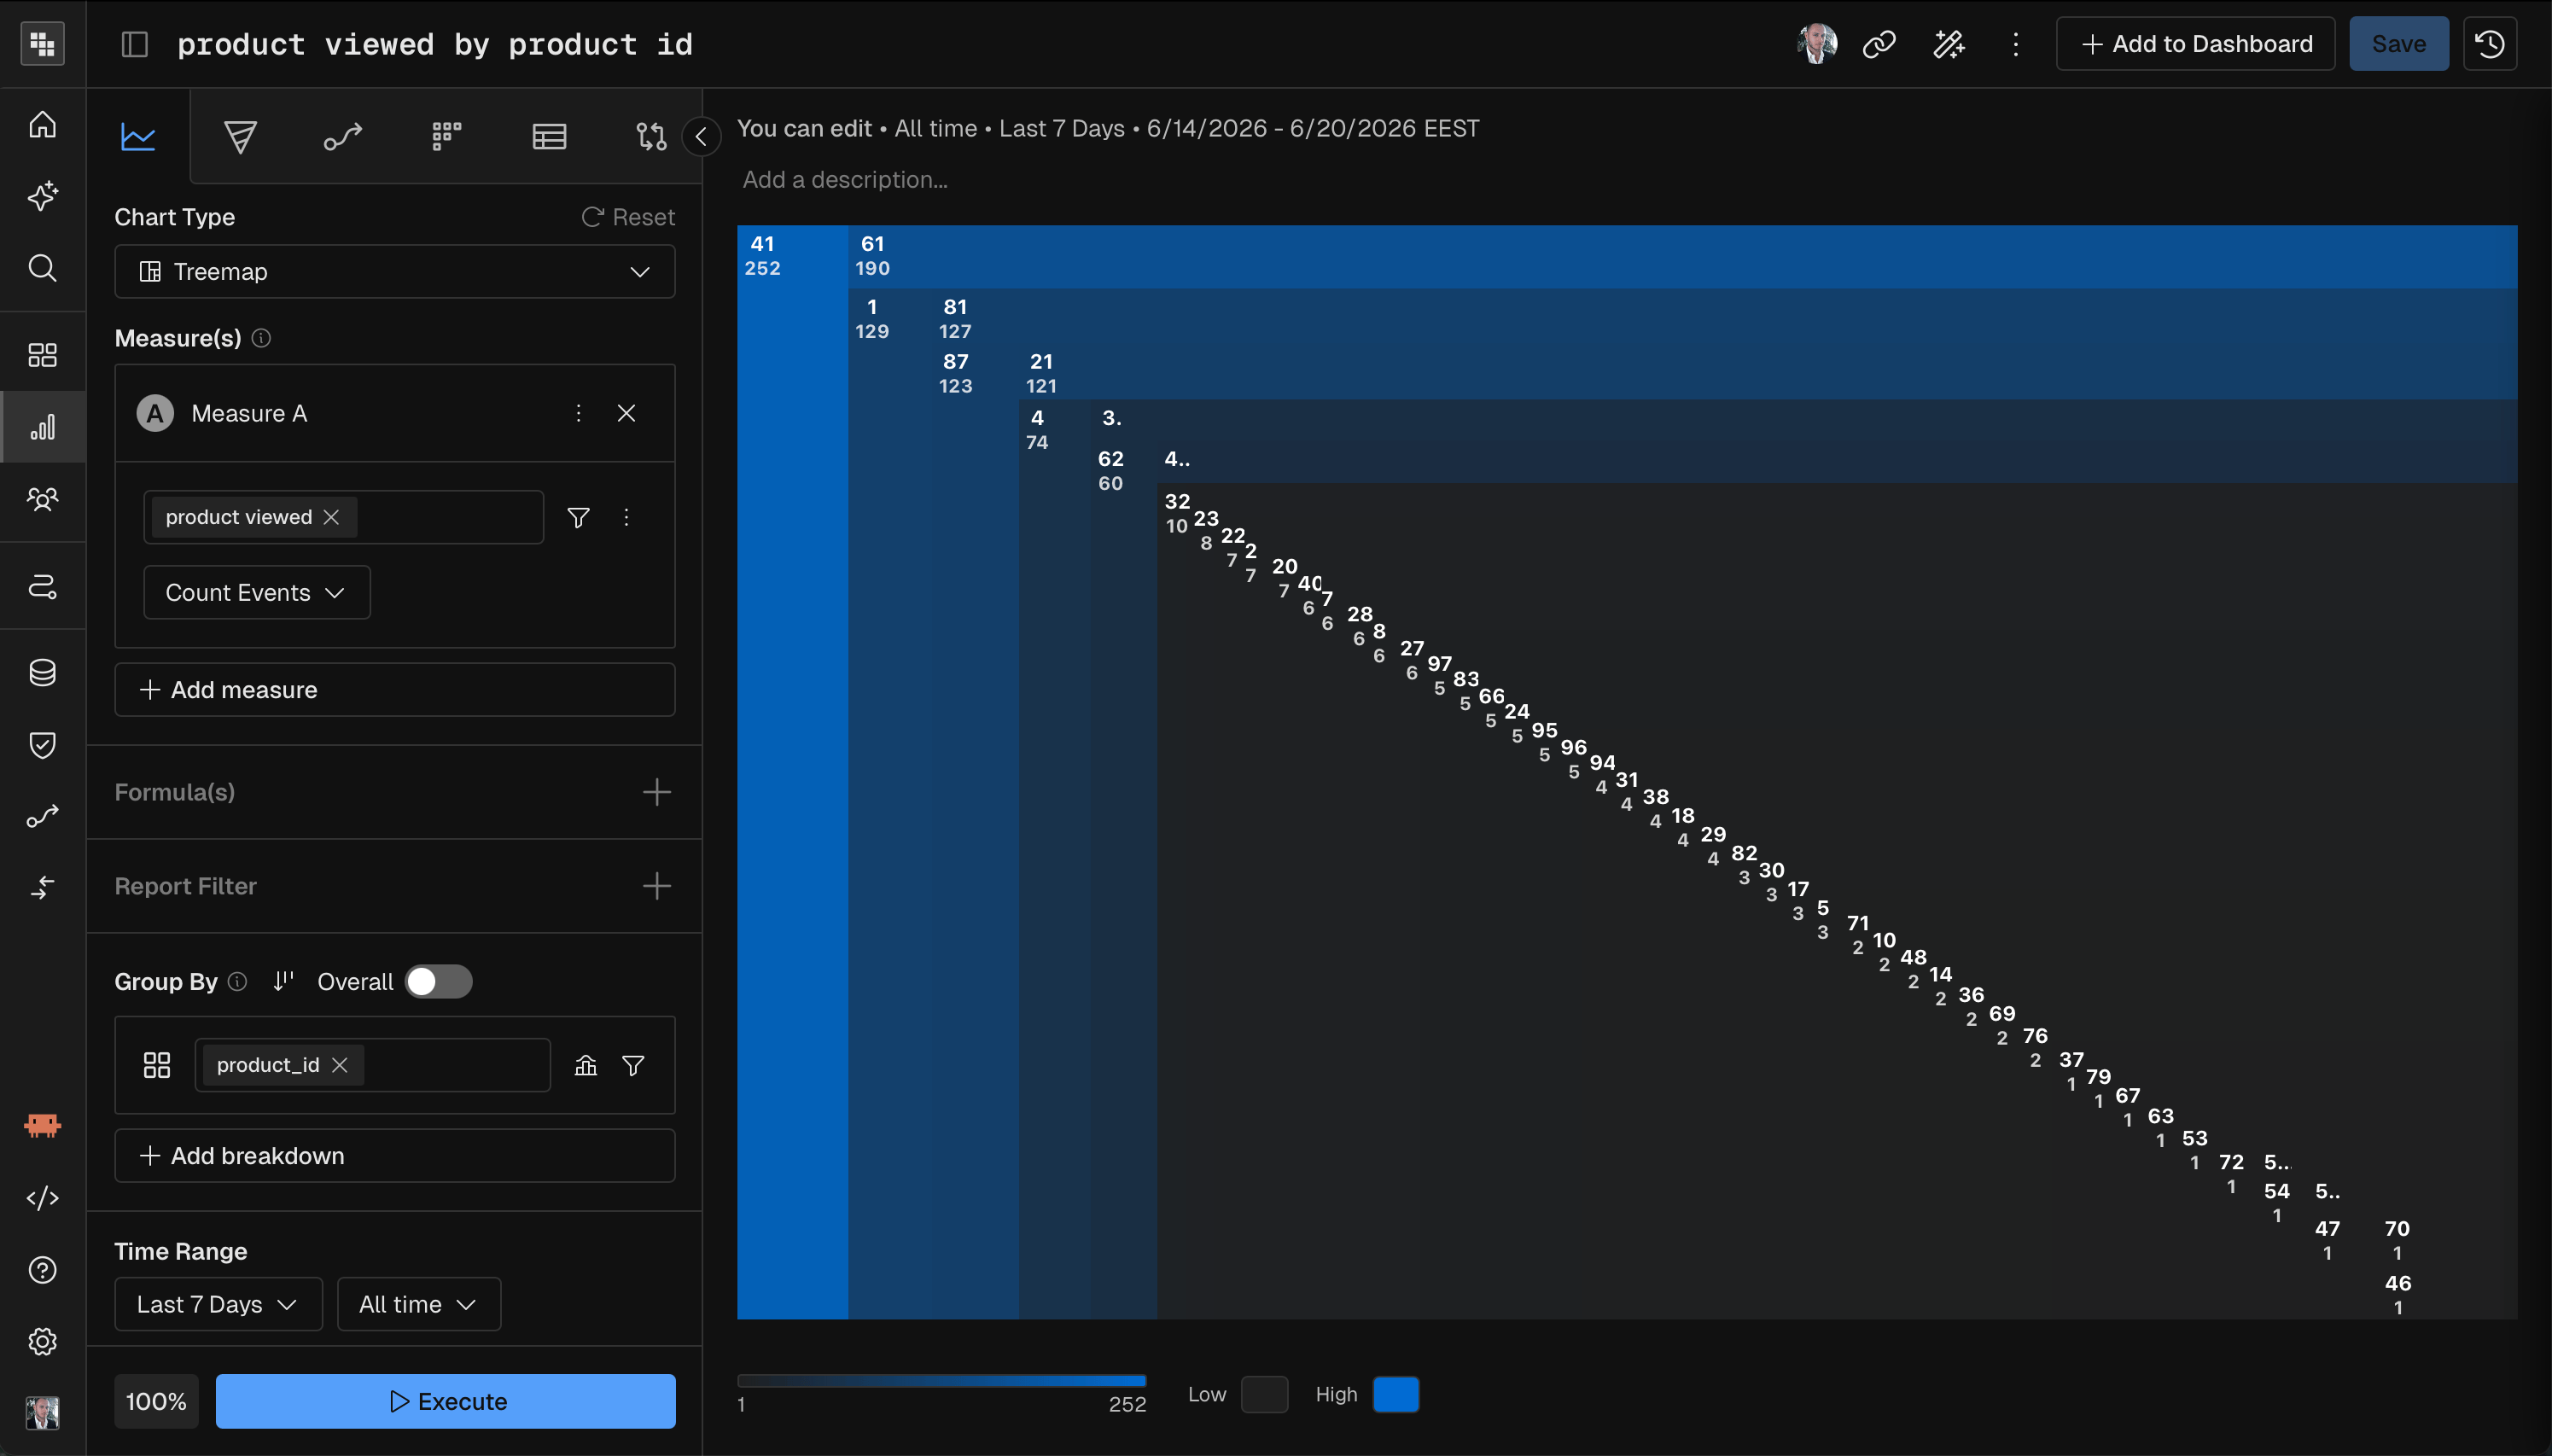
Waterfall
A Waterfall chart shows how individual components add up to a total. Use it to see which parts contribute most, such as which event types make up the total count.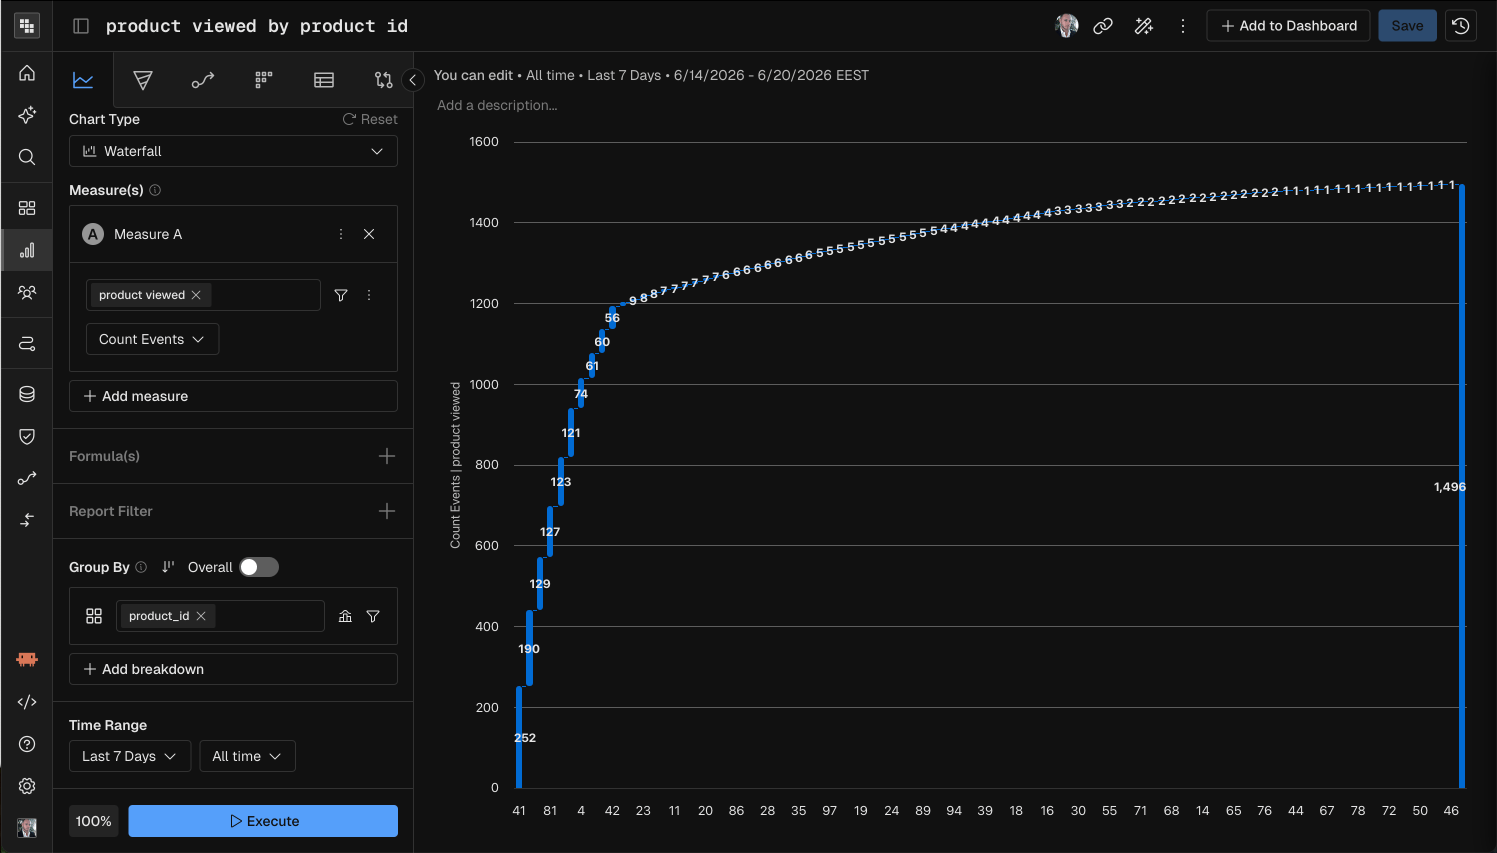
Correlation charts
Scatter
A Scatter chart maps measures to the X-axis, the Y-axis and bubble size. Use it to spot a correlation between two metrics, with a third metric as context.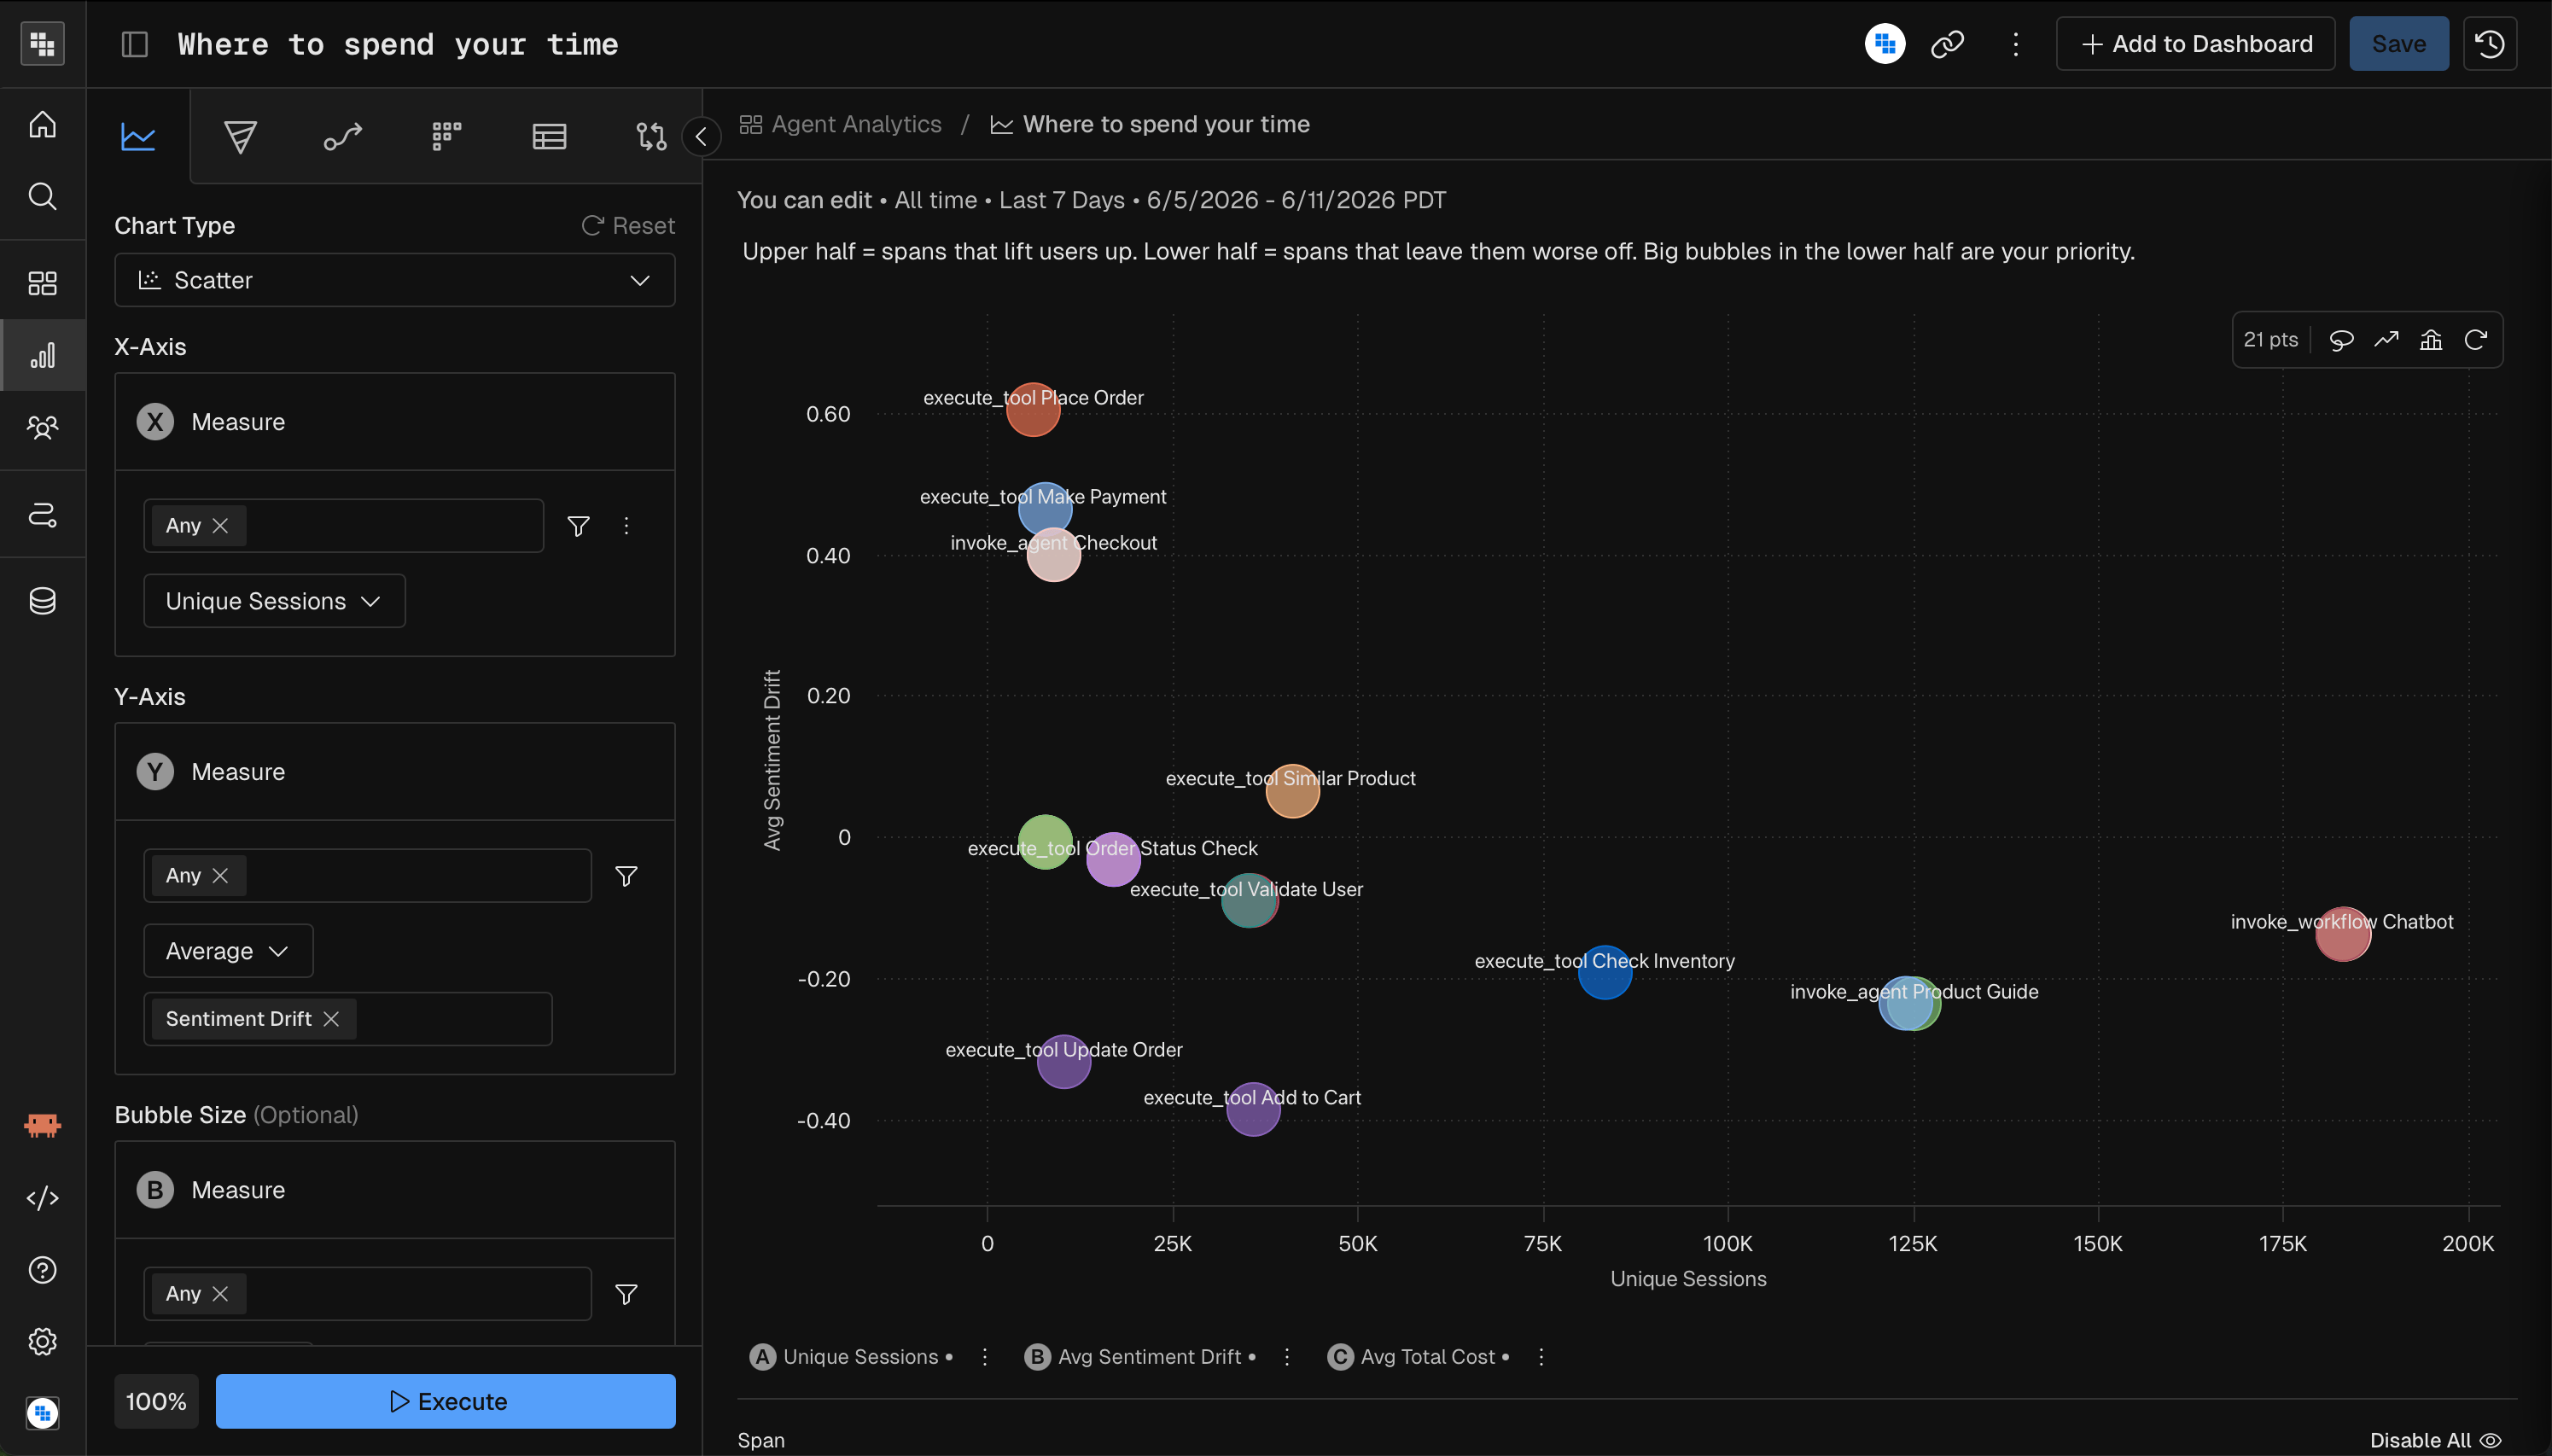
Heatmap
A Heatmap plots two dimensions on the X and Y axes, with color intensity showing the measure value. Use it to find patterns across two categorical dimensions, such as activity by day of week and hour.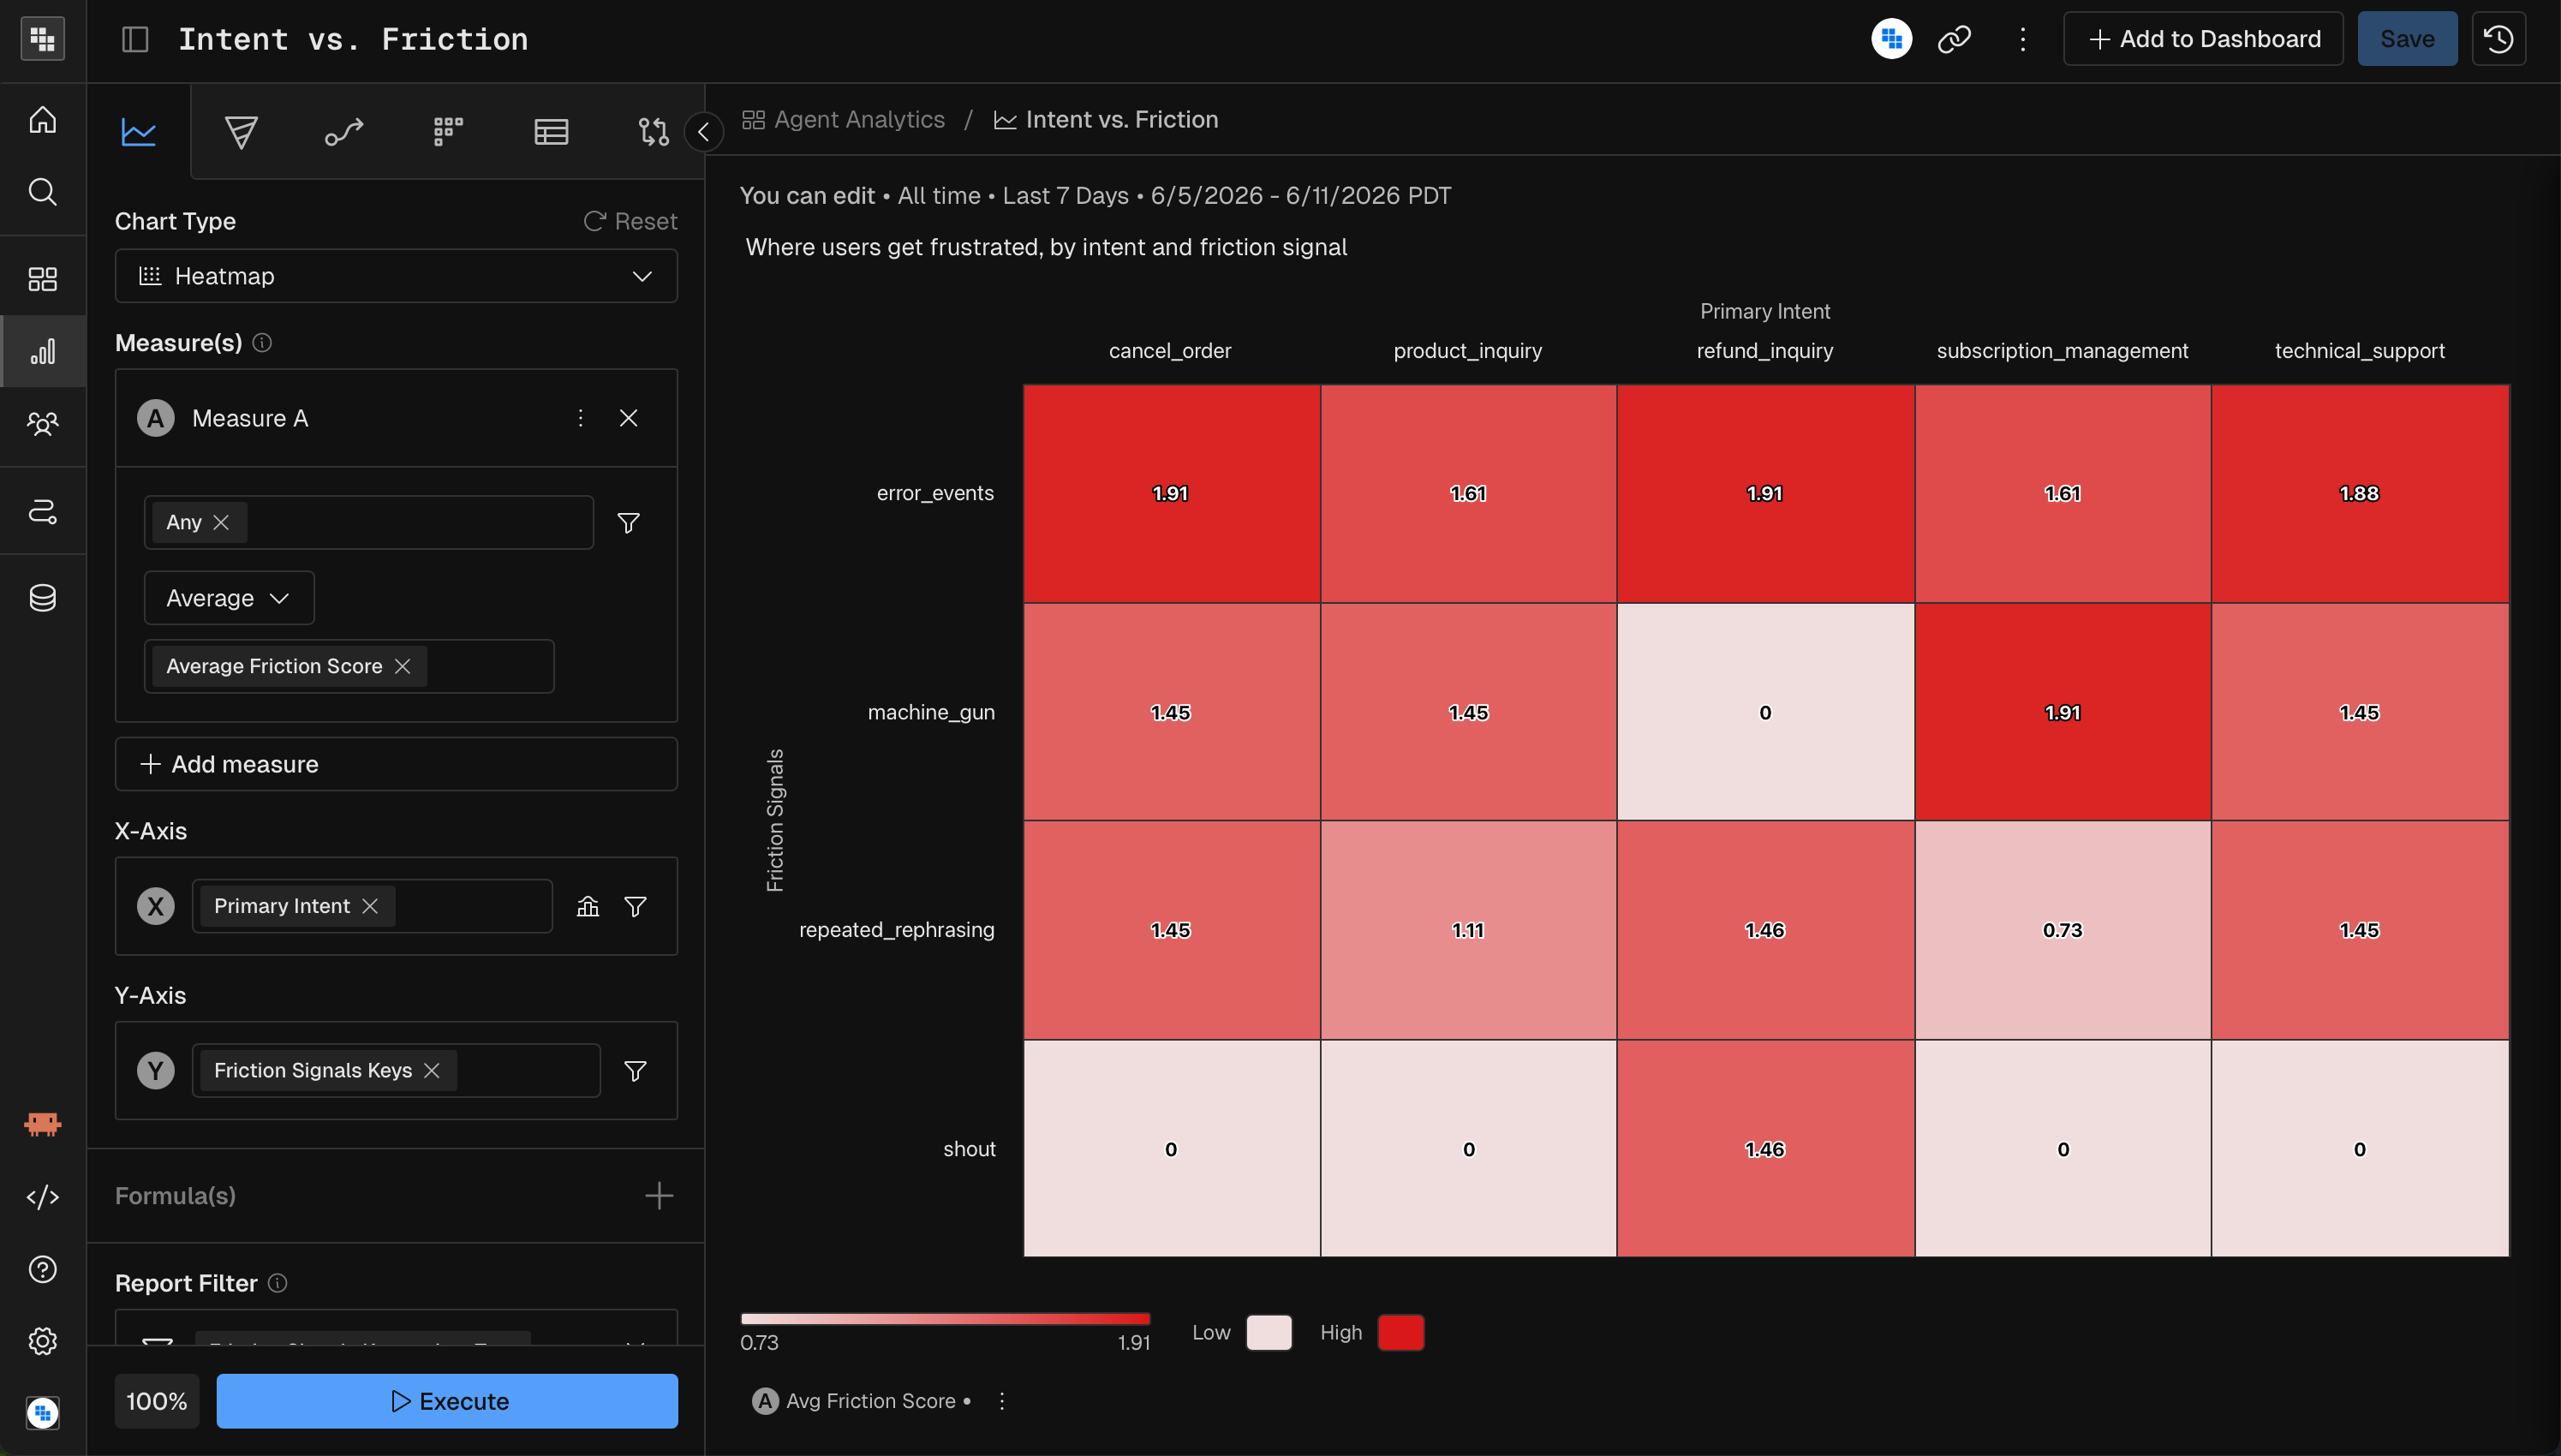
Metrics charts
KPI
A KPI chart shows one large number per measure, with an optional trend. Use it on dashboards and for at-a-glance indicators.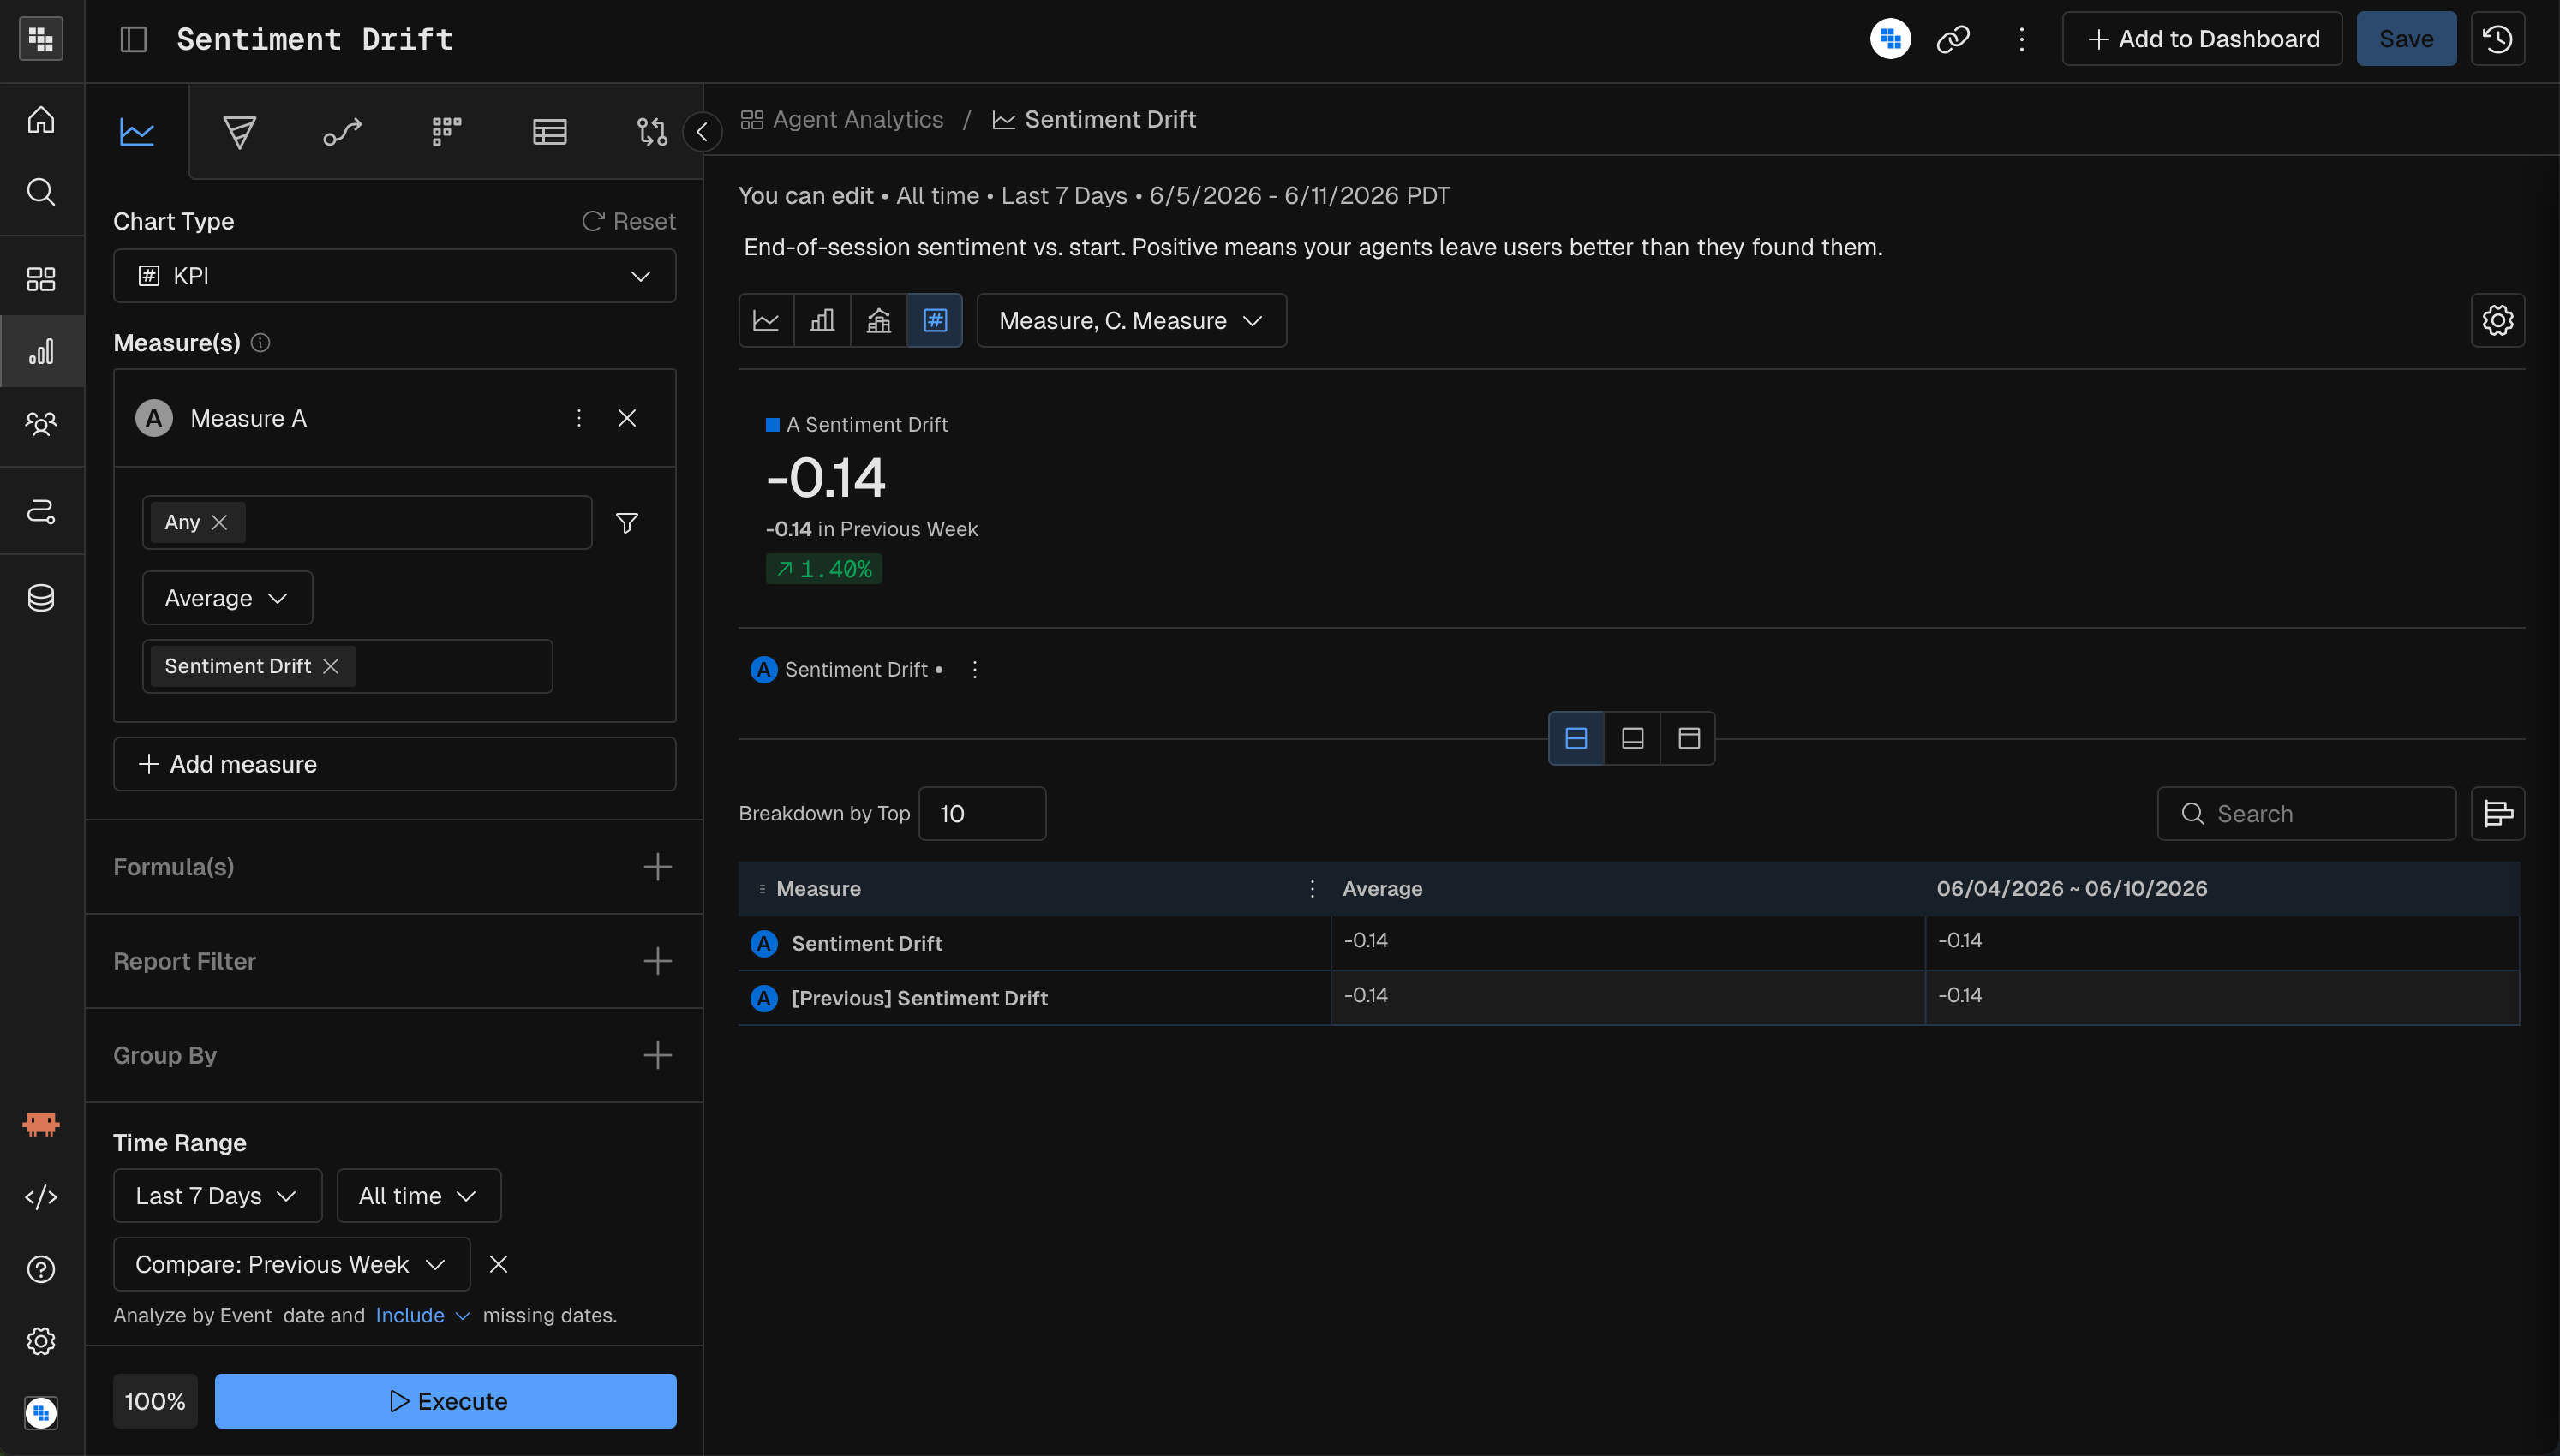
Impact
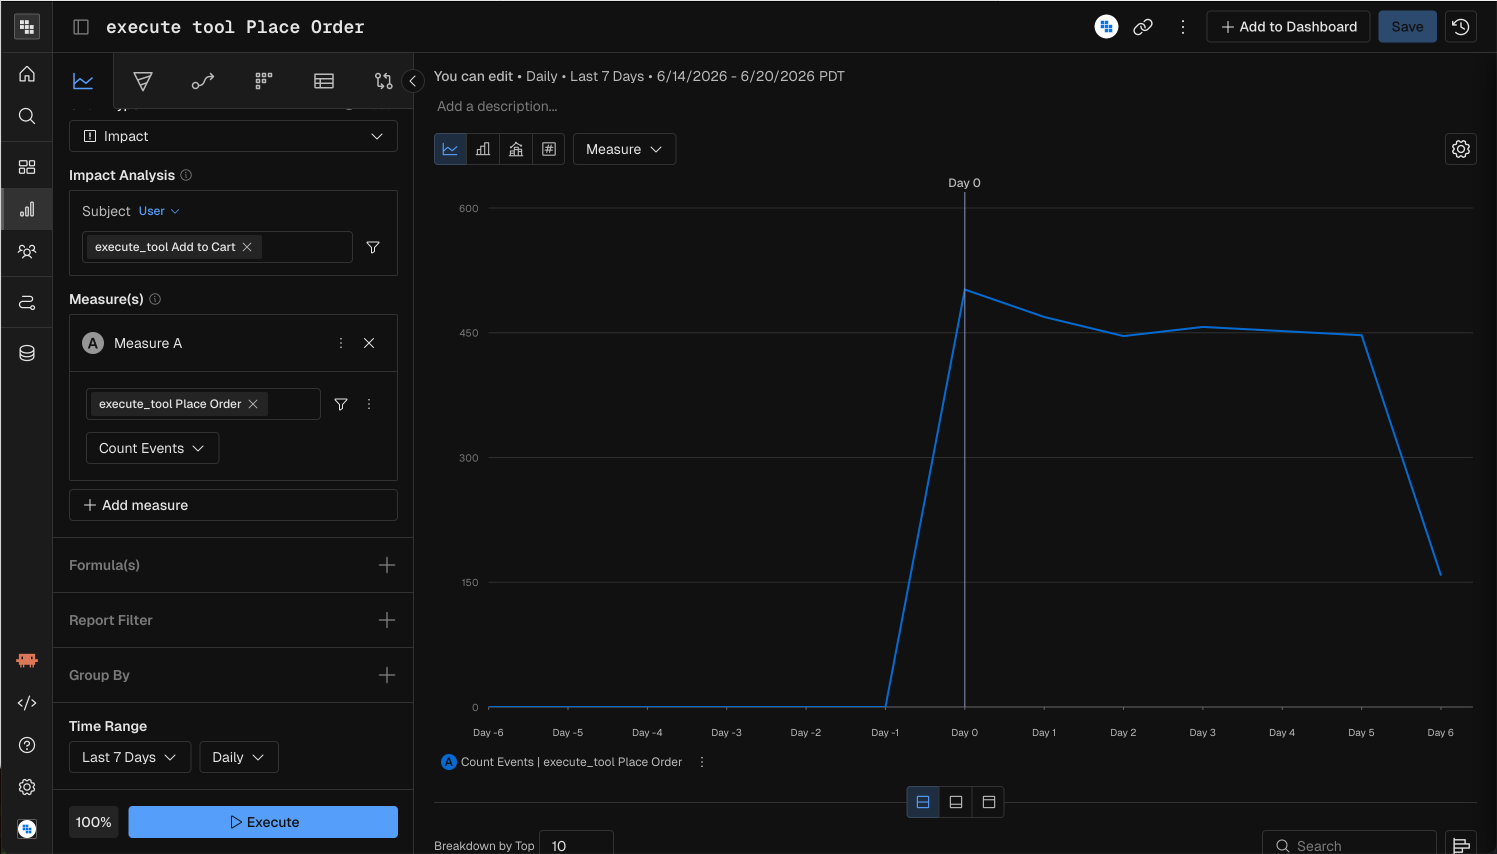
An Impact chart measures how a trigger event affects a metric over time. Use it to evaluate the effect of a product change, feature launch or campaign. The question it answers is “What is the impact on Metric A after a user engages with Event A?”
Example questions for an Impact chart:
Build an Impact analysis
- Set the chart type in Query to Impact.
- Build the measure that the event should affect. Typically this is Sum, a count of events, or a compound measure such as a percentage per user.
- Apply any filters or breakdowns.
- Set the date range.
- Select the trigger event: the event you expect to affect the measure from step 2, such as Campaign Impression, Content Recommended or Signed In.
- Click Execute.
Read the results
In the example above, the Place Order count rises from Day 0, which shows that Add to Cart had a positive effect on order placement in that period.
Quick reference
MCP prompt examples
“Create a stacked bar chart of daily tool calls by primary intent for the last 7 days”
“Show me a heatmap of average friction score by primary intent and friction signal for the last 7 days”
“What is the impact on Place Order count after a user triggers Add to Cart, last 7 days?”
Related
- Query report: build measures and prompt Kubit through MCP.
- Formula: combine measures for chart types that need a single value.
- Chart settings and formatting: axes, formats and reference lines.