

When to use
Rolling measures
A rolling measure computes a measure over the last X days for every day in the date range. It answers questions like “What are my weekly active users on a daily basis?” or “What’s the moving average for each day?”Rolling options
There are three rolling options. Each one takes a number of days: pick a preset, or type your own.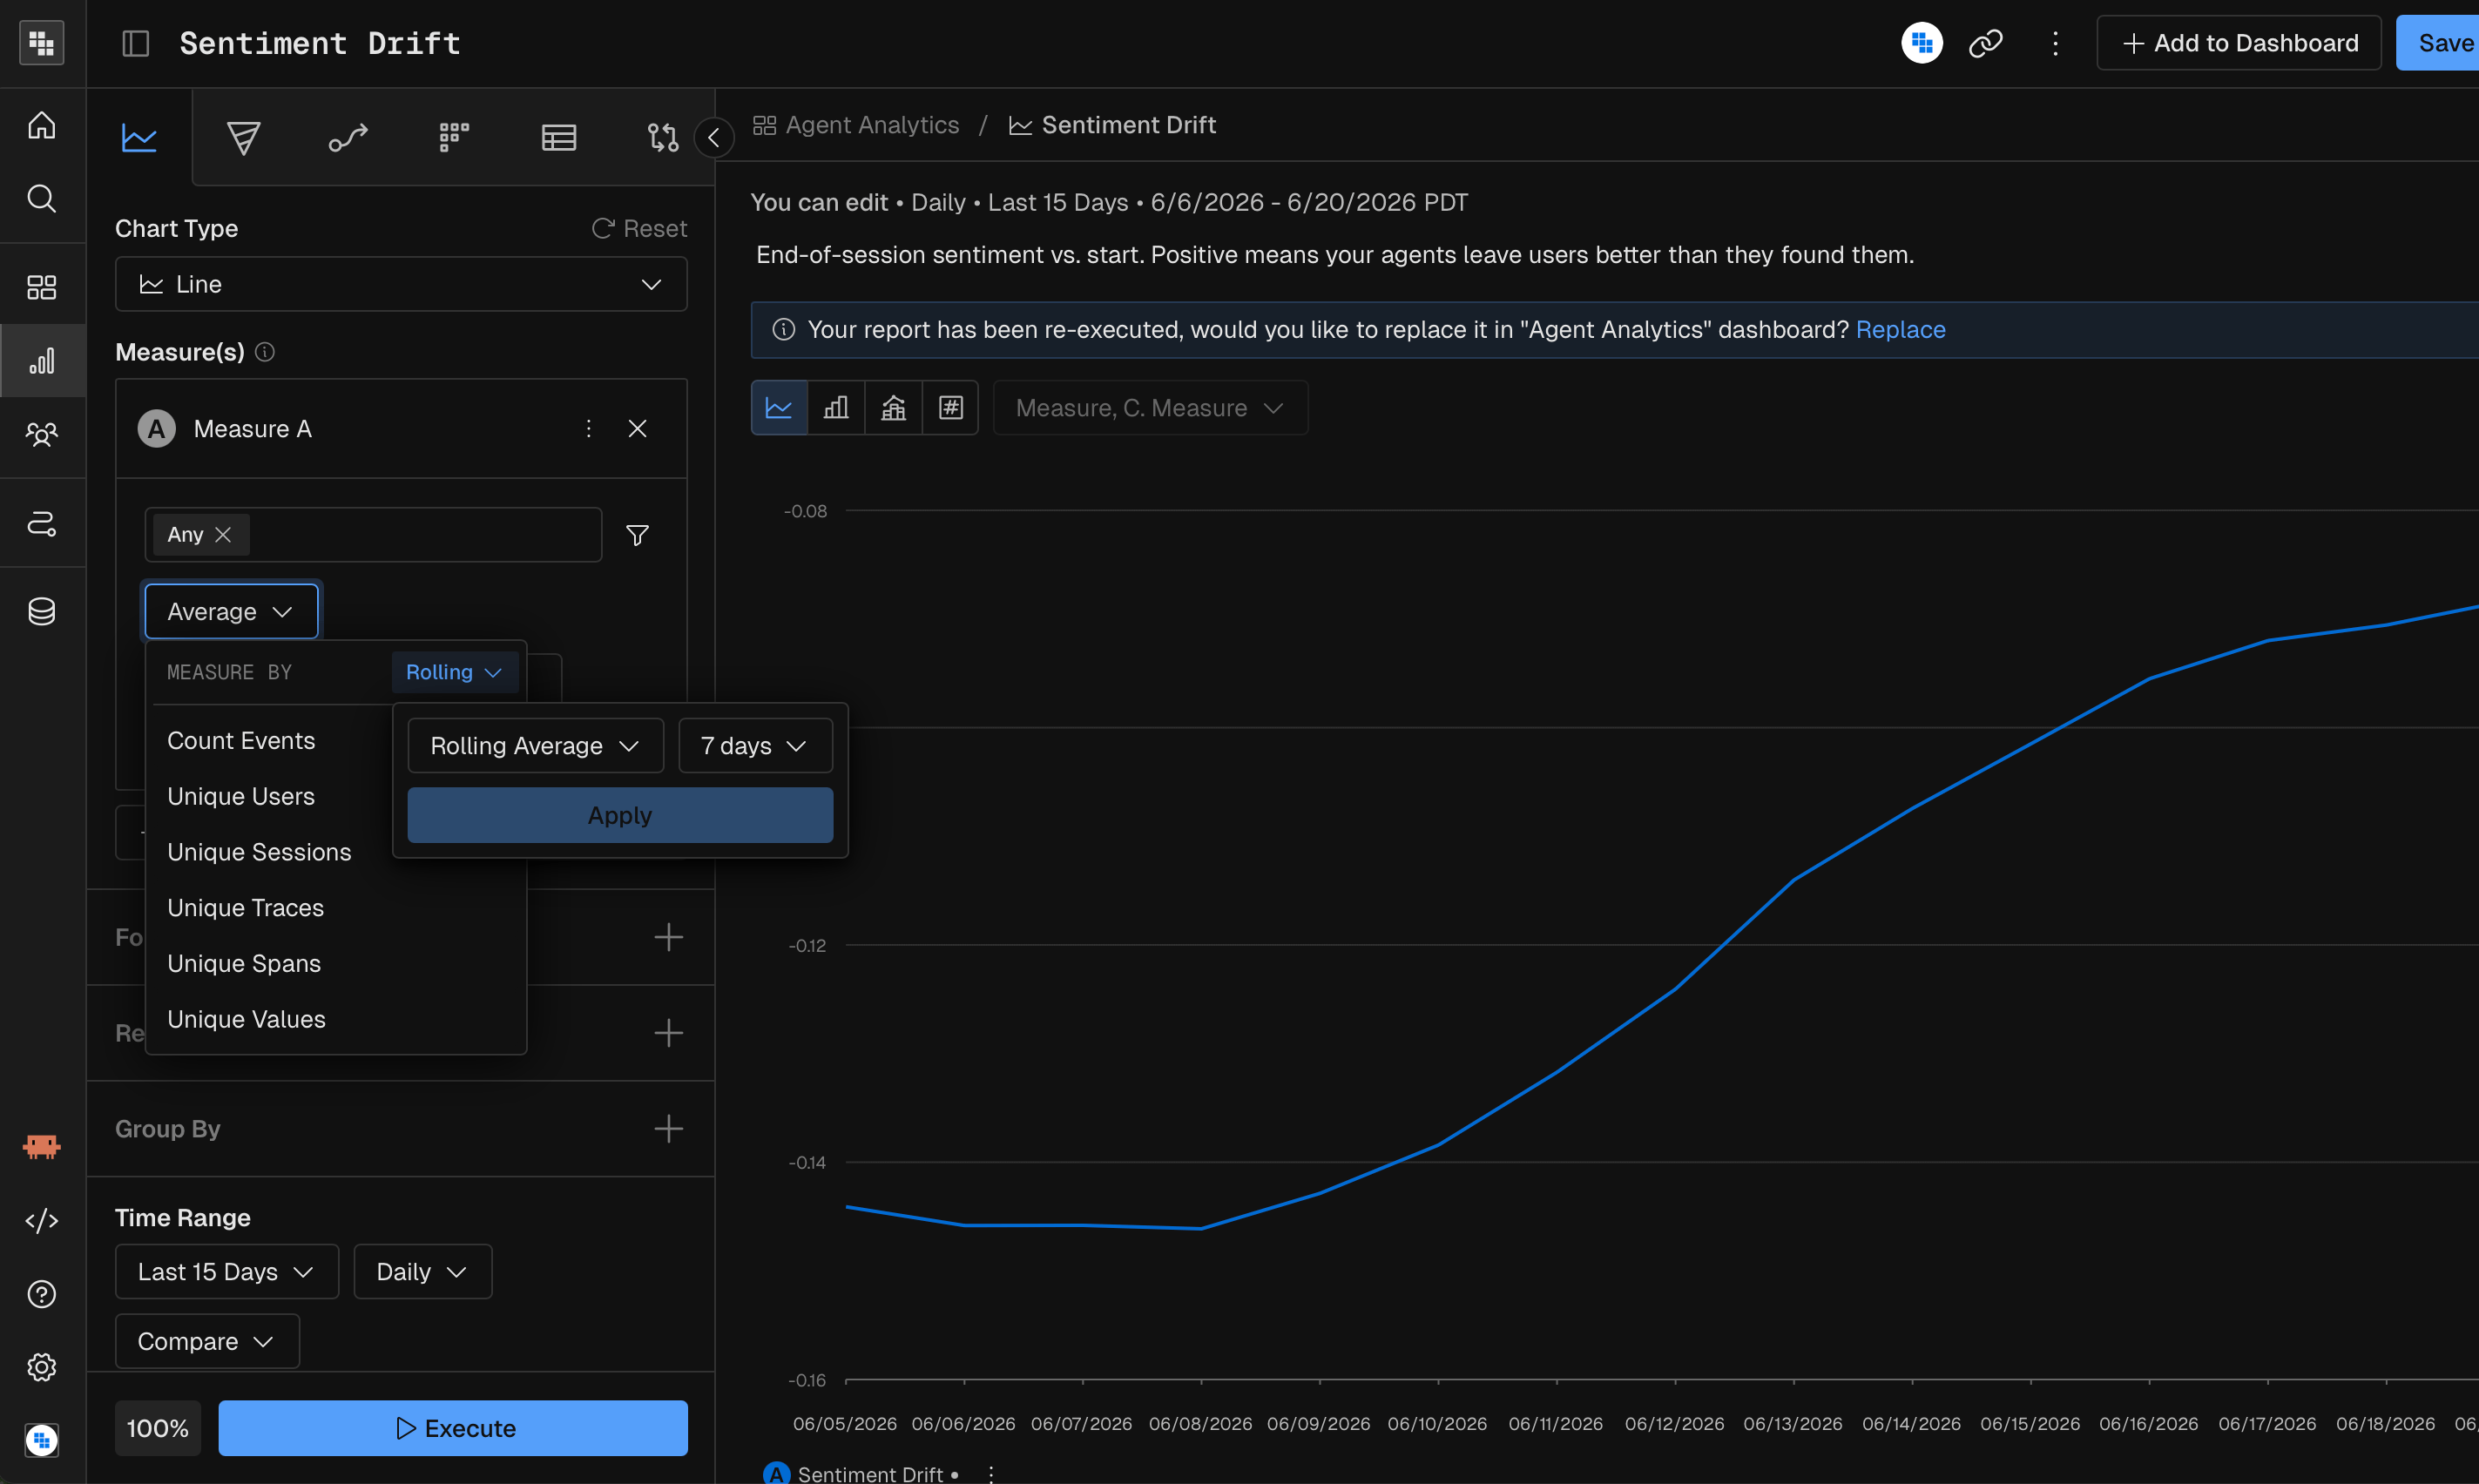
Build a rolling measure
- Build your measure in Query.
- Open the Measure By dropdown under the selected event. Click Rolling at the top right of the dropdown.
- Select a rolling option. Select a preset number of days, or enter your own, and confirm it (the screenshot shows an Apply button).
- Click Execute.
Compound rolling measures
You can build several rolling measures in one report and combine them in a formula.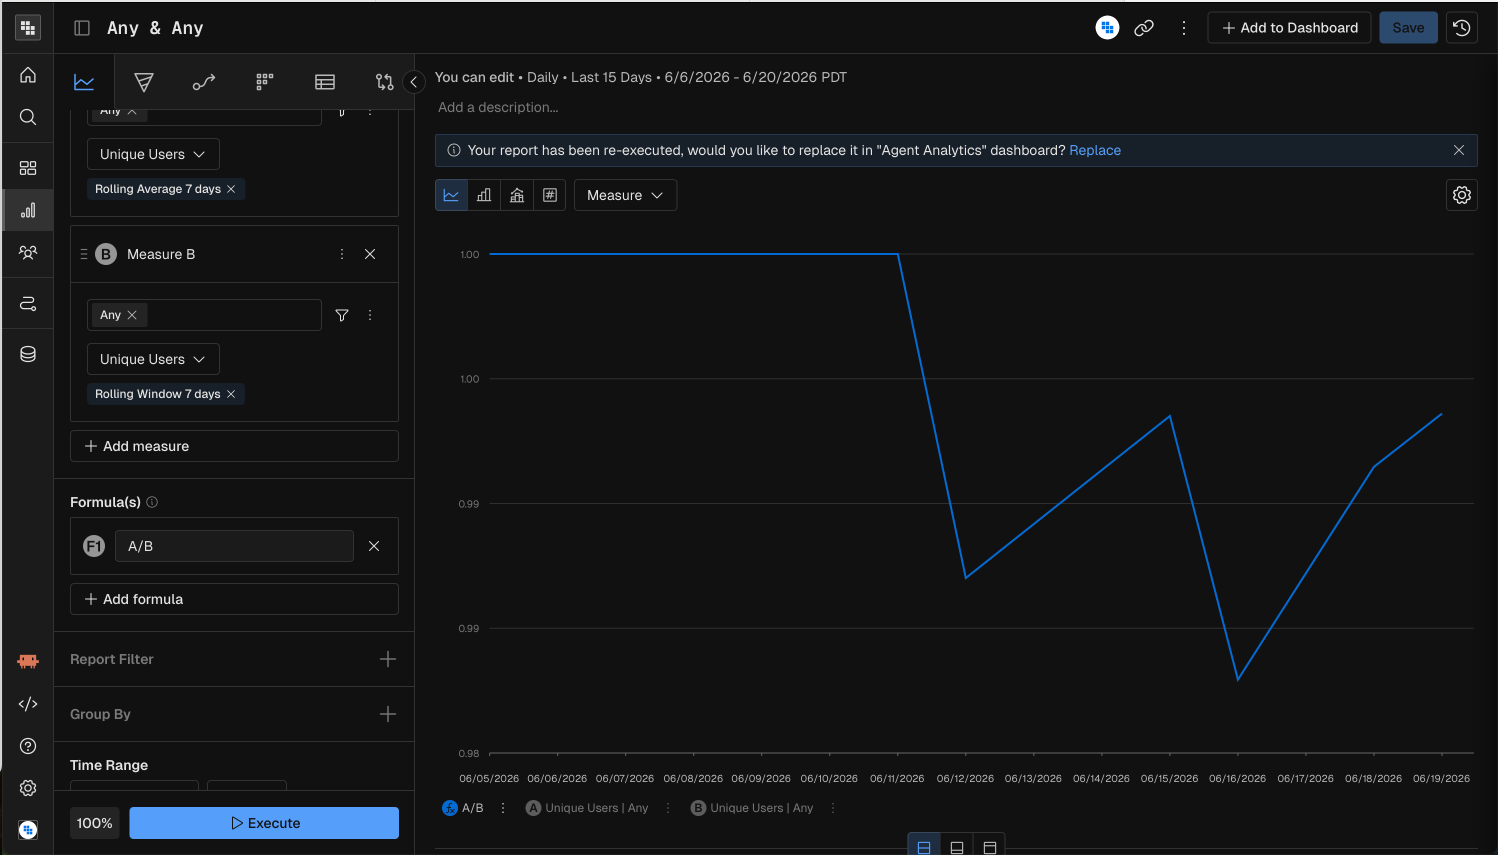
Measure filters
A measure filter keeps or drops rows by the value of a measure. Use it to exclude outliers, or to avoid division by 0 when you break down a ratio.How it works
In this example, a breakdown by status message has a long tail of small values.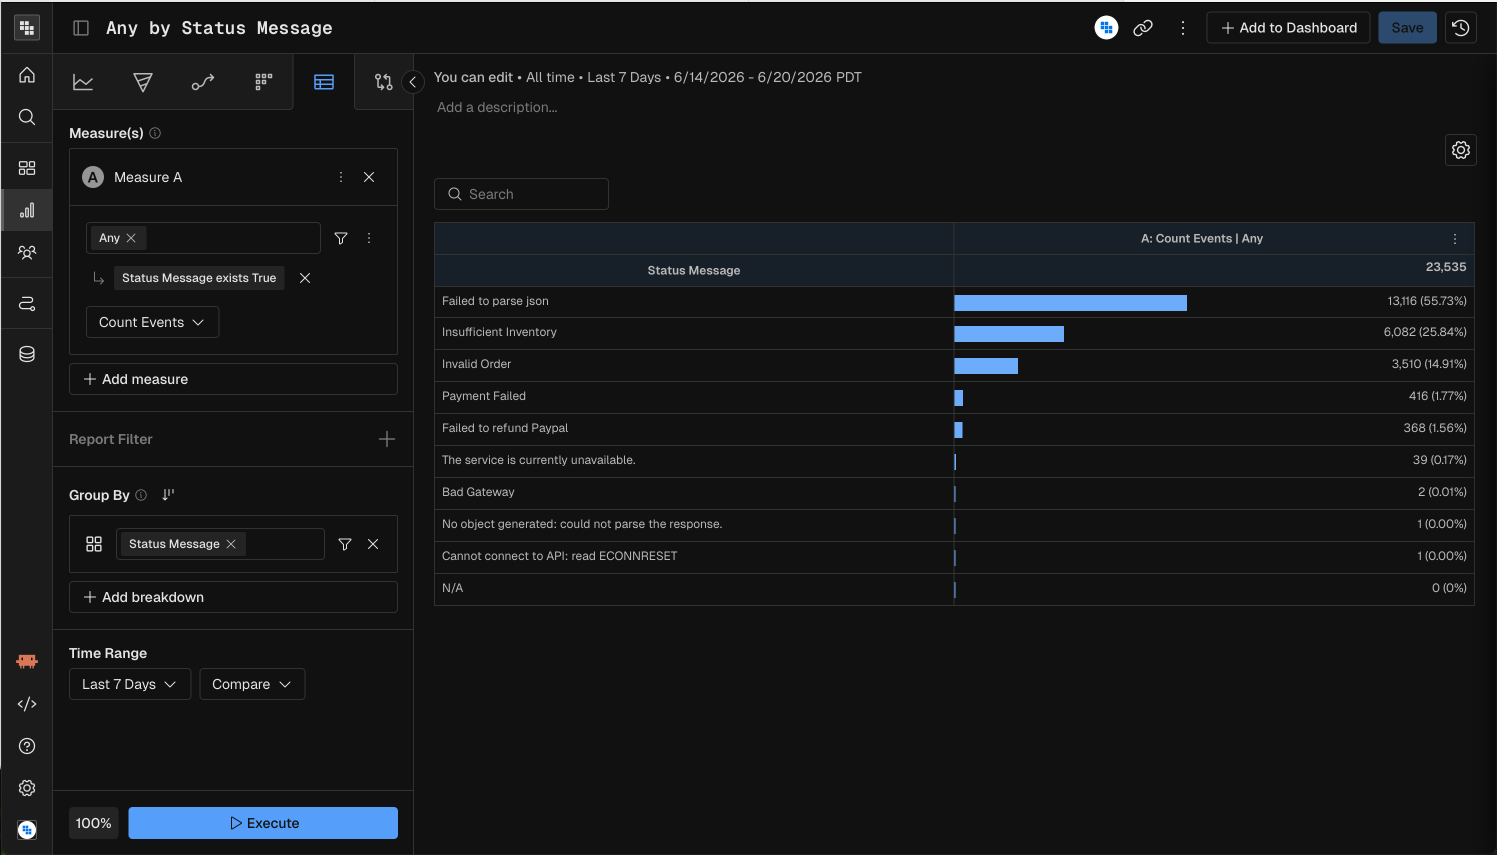
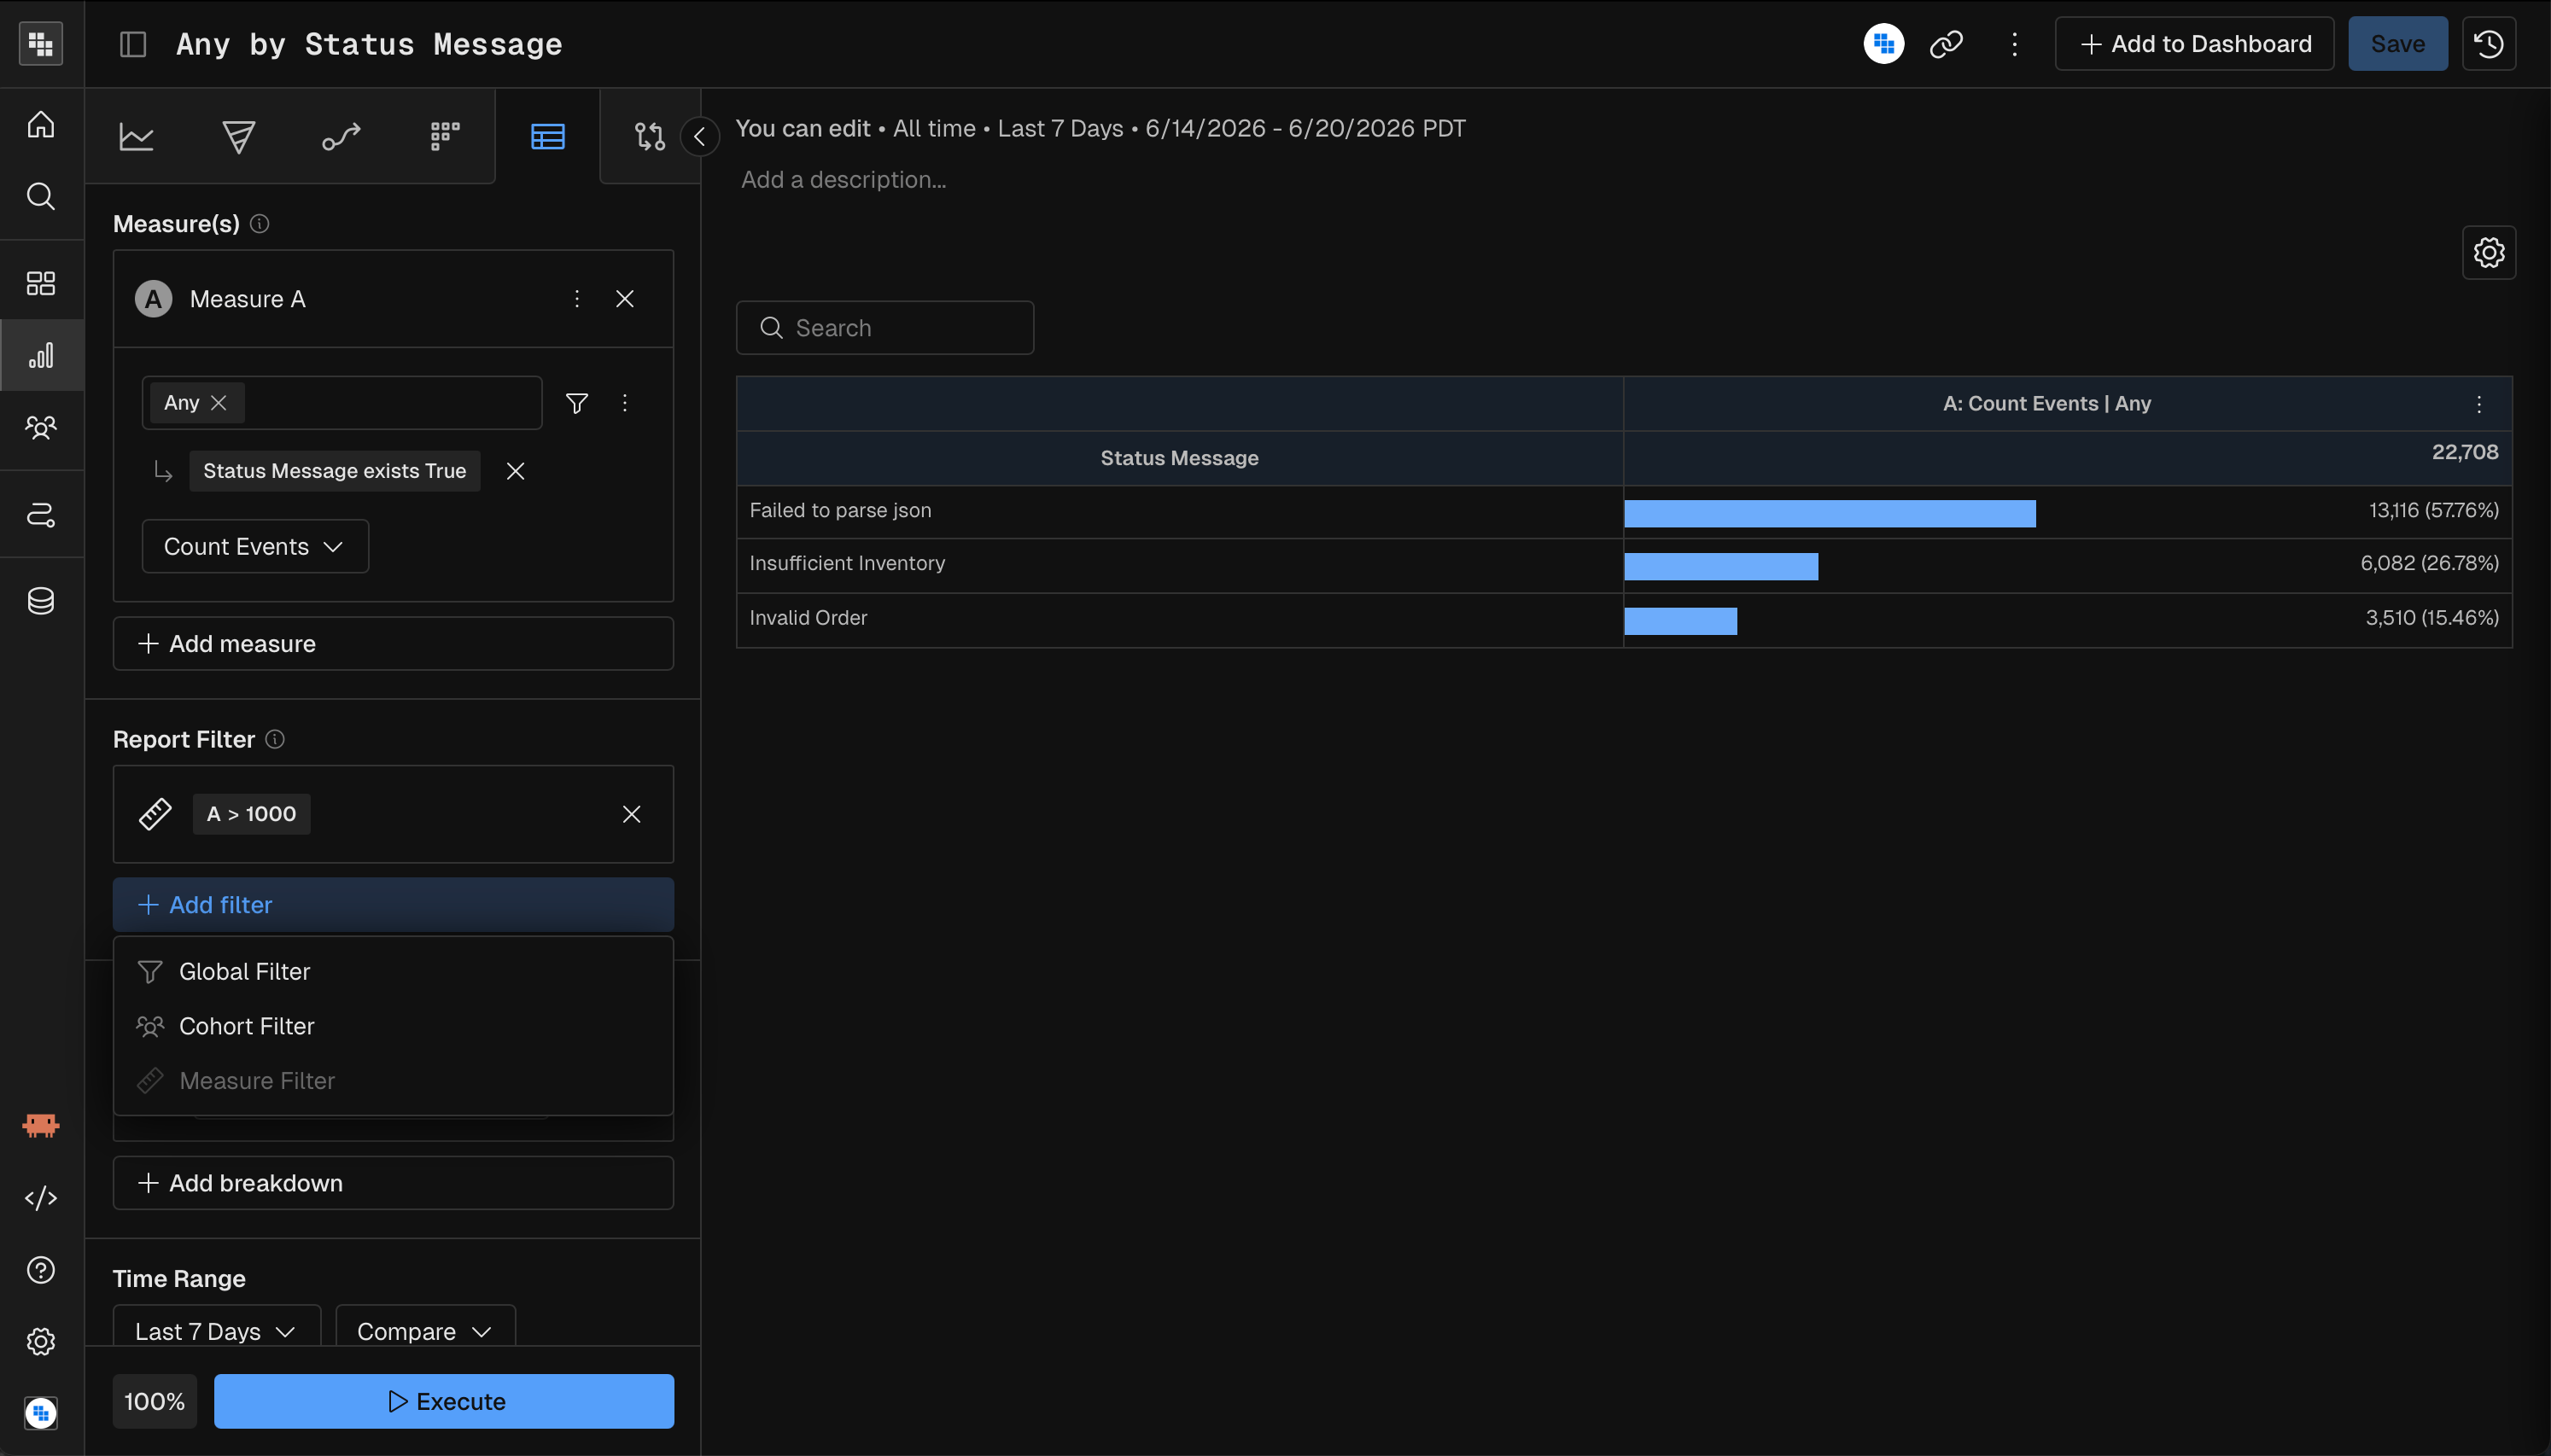
A > 1000. Under Report Filter, click Add filter > Measure Filter, then enter the condition. The table then keeps only the rows where measure A is over 1000.
MCP prompt examples
“Show me a rolling 7-day average of unique users per day for the last 30 days”
“Create a line chart of daily DAU/WAU: rolling 7-day average of unique users divided by a rolling 7-day window of unique users”
“Show event counts by status message for the last 7 days, only where the count is over 1000”
Related
- Query report: measures and measure functions.
- Formula: combine rolling measures.
- Filters: global and cohort filters.