

When to use
| Use case | Example |
|---|---|
| Read exact values behind a chart | The daily count for each breakdown value |
| Find one row in a long breakdown | Filter the table to the spans whose name contains checkout |
| Focus a chart on a few series | Hide every country except the top 5 |
| Take the data into another tool | Export the report as a CSV file |
View Modes
The report builder has three layouts. Switch between them with the view icons below the chart. Each icon’s tooltip names its layout.| Mode | Description |
|---|---|
| Chart and Table | The chart and the table together. This is the default in build mode. |
| Chart | Only the chart |
| Table | Only the data table |
Table View Features
Sorting
Click a column header to sort by that column. Sorting works alphabetically and numerically, ascending or descending.Column Filtering
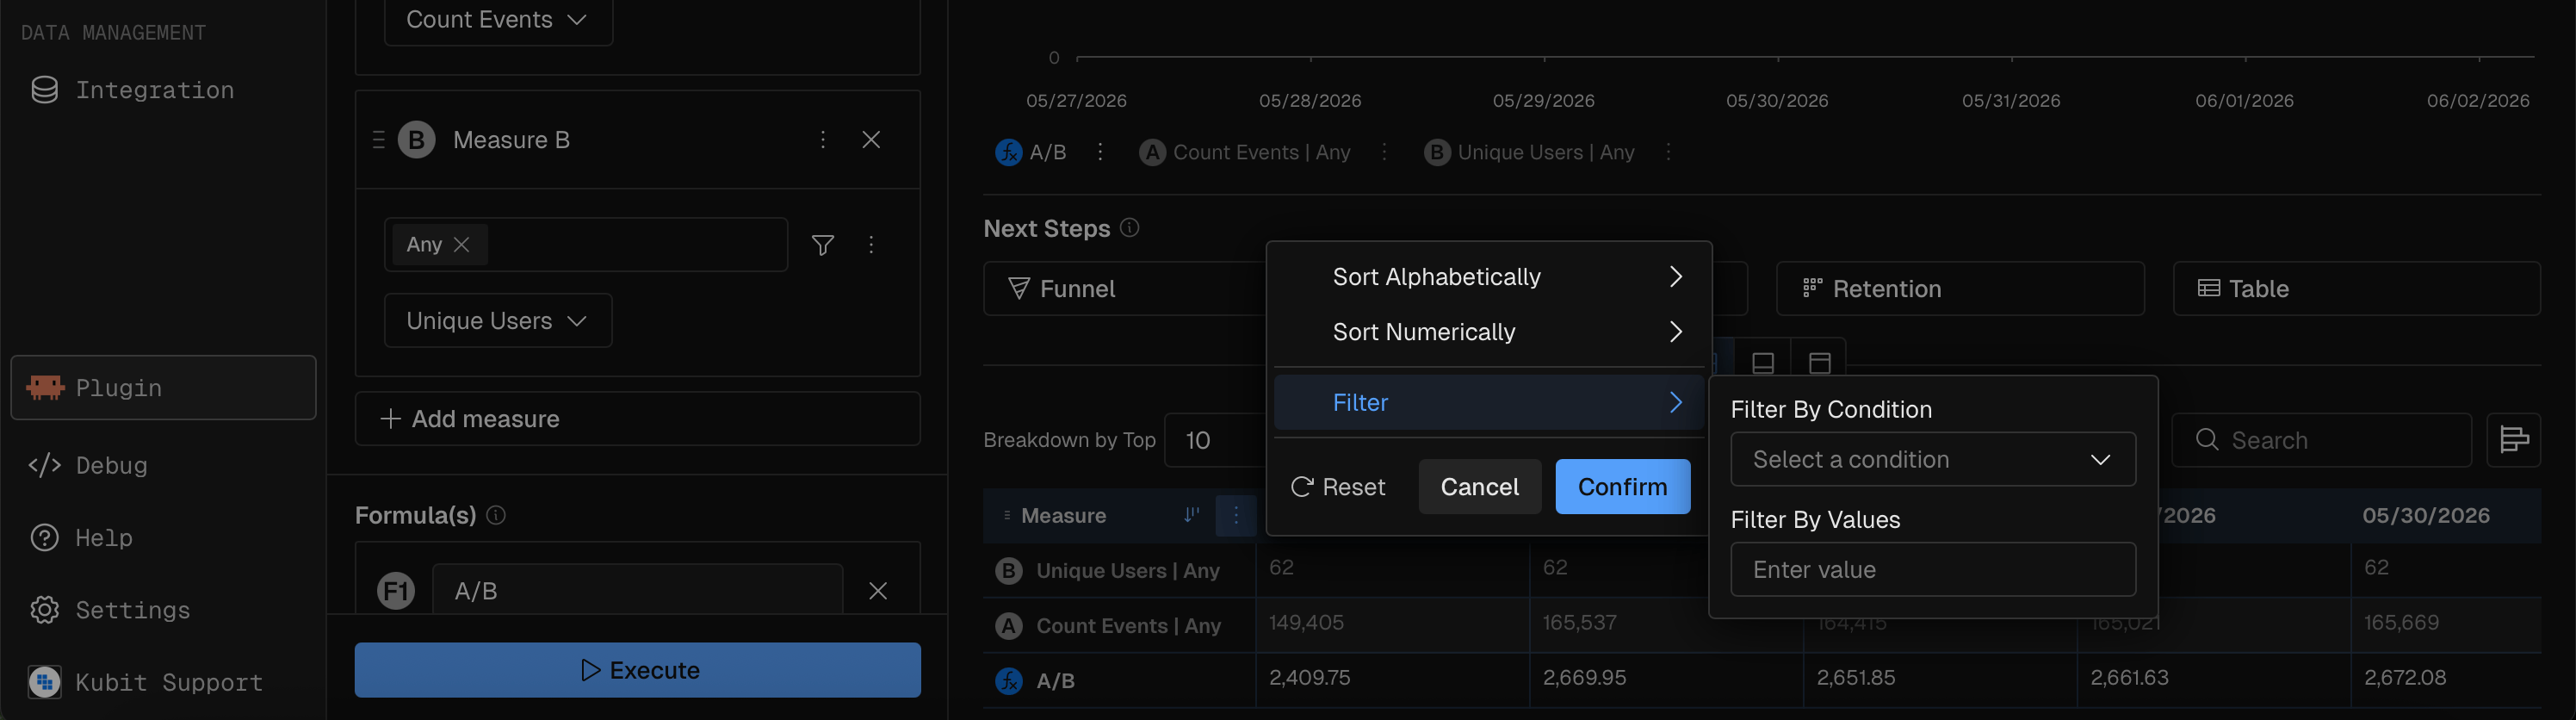
Each column has a filter menu (the three-dot icon in the column header) with Sort Alphabetically, Sort Numerically and Filter. Under Filter, Filter By Condition takes one of these operators, and Filter By Values takes a value.| Operator | Description |
|---|---|
| Equals | Exact match |
| Does not equal | Excludes an exact match |
| Begins with | Prefix match |
| Does not begin with | Excludes a prefix |
| Ends with | Suffix match |
| Does not end with | Excludes a suffix |
| Contains | Substring match |
| Does not contain | Excludes a substring |
Column Resizing
Drag a column border to change its width. The minimum width is 160px. Widths are saved with the report.Horizontal Bars
Horizontal bars show an inline bar in each table cell, so you can compare relative sizes at a glance. To turn them on or off, click the horizontal bar chart icon in the table’s header, next to the search field. Its tooltip reads Show horizontal bars or Hide horizontal bars.Percent Change
The Query table view has no percent change column. A Data Table report with a comparison has a Show % Change button that adds one.Hide and show data
You can hide parts of a report without changing its query. These controls are in the legend below the chart.Hide or show a measure
Click a measure chip in the legend to hide or show that measure. A hidden measure is grayed out. Hiding a measure affects both the chart and the data table. Availability: on Scatter and Heatmap charts, you can’t hide a measure, because each measure is tied to a position (X-axis, Y-axis or bubble size).Hide or show a breakdown value
Click a group value chip in the legend to hide or show that series. In a chart broken down by country, for example, click “US” to hide or show the US series. Kubit limits how many series are visible at once so the chart stays readable.
Turning on one more value past the limit shows the toast “Maximum groups reached. Unselect one to continue.” To switch every series on or off at once, use Enable All or Disable All (the eye icon).
Hide Others
Hide Others removes the “Others” category, which collects every breakdown value that isn’t shown by name, from the chart and the table. On a stacked chart, hiding “Others” also recalculates the percentages from the visible groups only.Export to CSV
Open the report’s options menu (the three-dot icon in the report header) and click Export as CSV. Kubit builds the file on the server and your browser downloads it.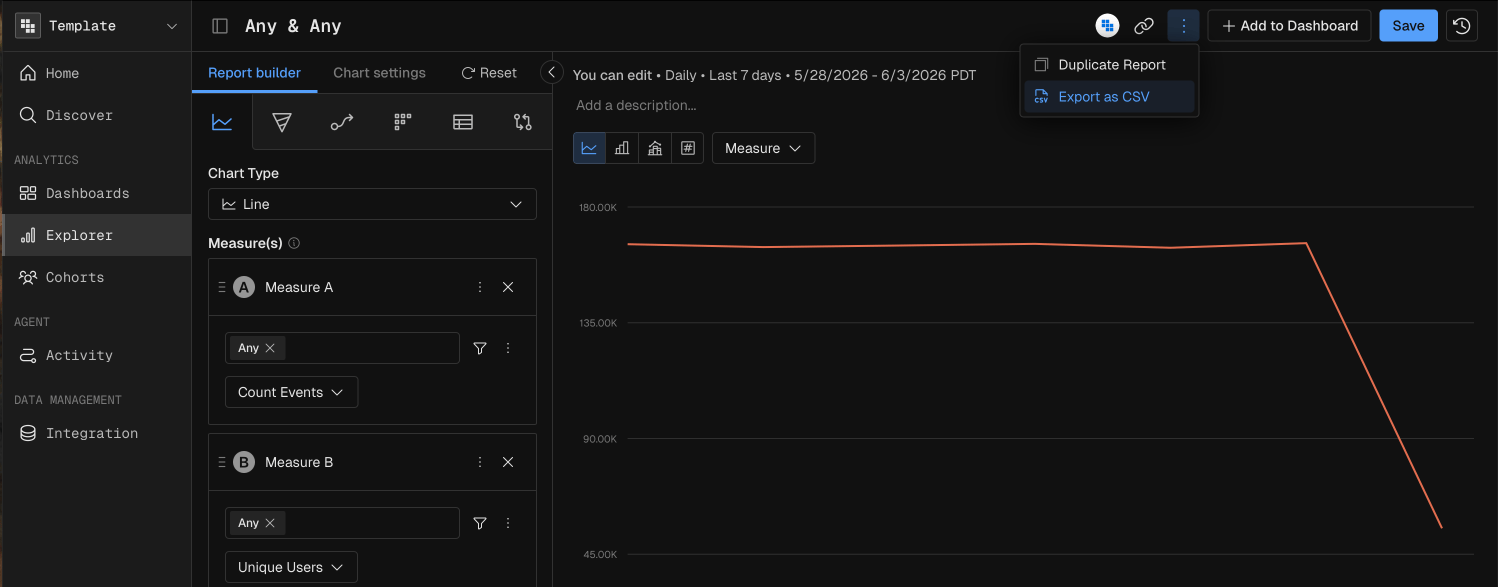
Example Prompts
“Show me a table of event count by span name for the last 7 days, sorted by count descending”
“Create a report of daily active users by country. I only want to see the top 5 countries.”
“Export the daily revenue data as CSV for the last quarter”
Related
- Chart settings and formatting: stacked chart and sorting settings.
- Data Table report: a report type built around the table.
- Group by and binning: the breakdowns that make up the series.