

When to use
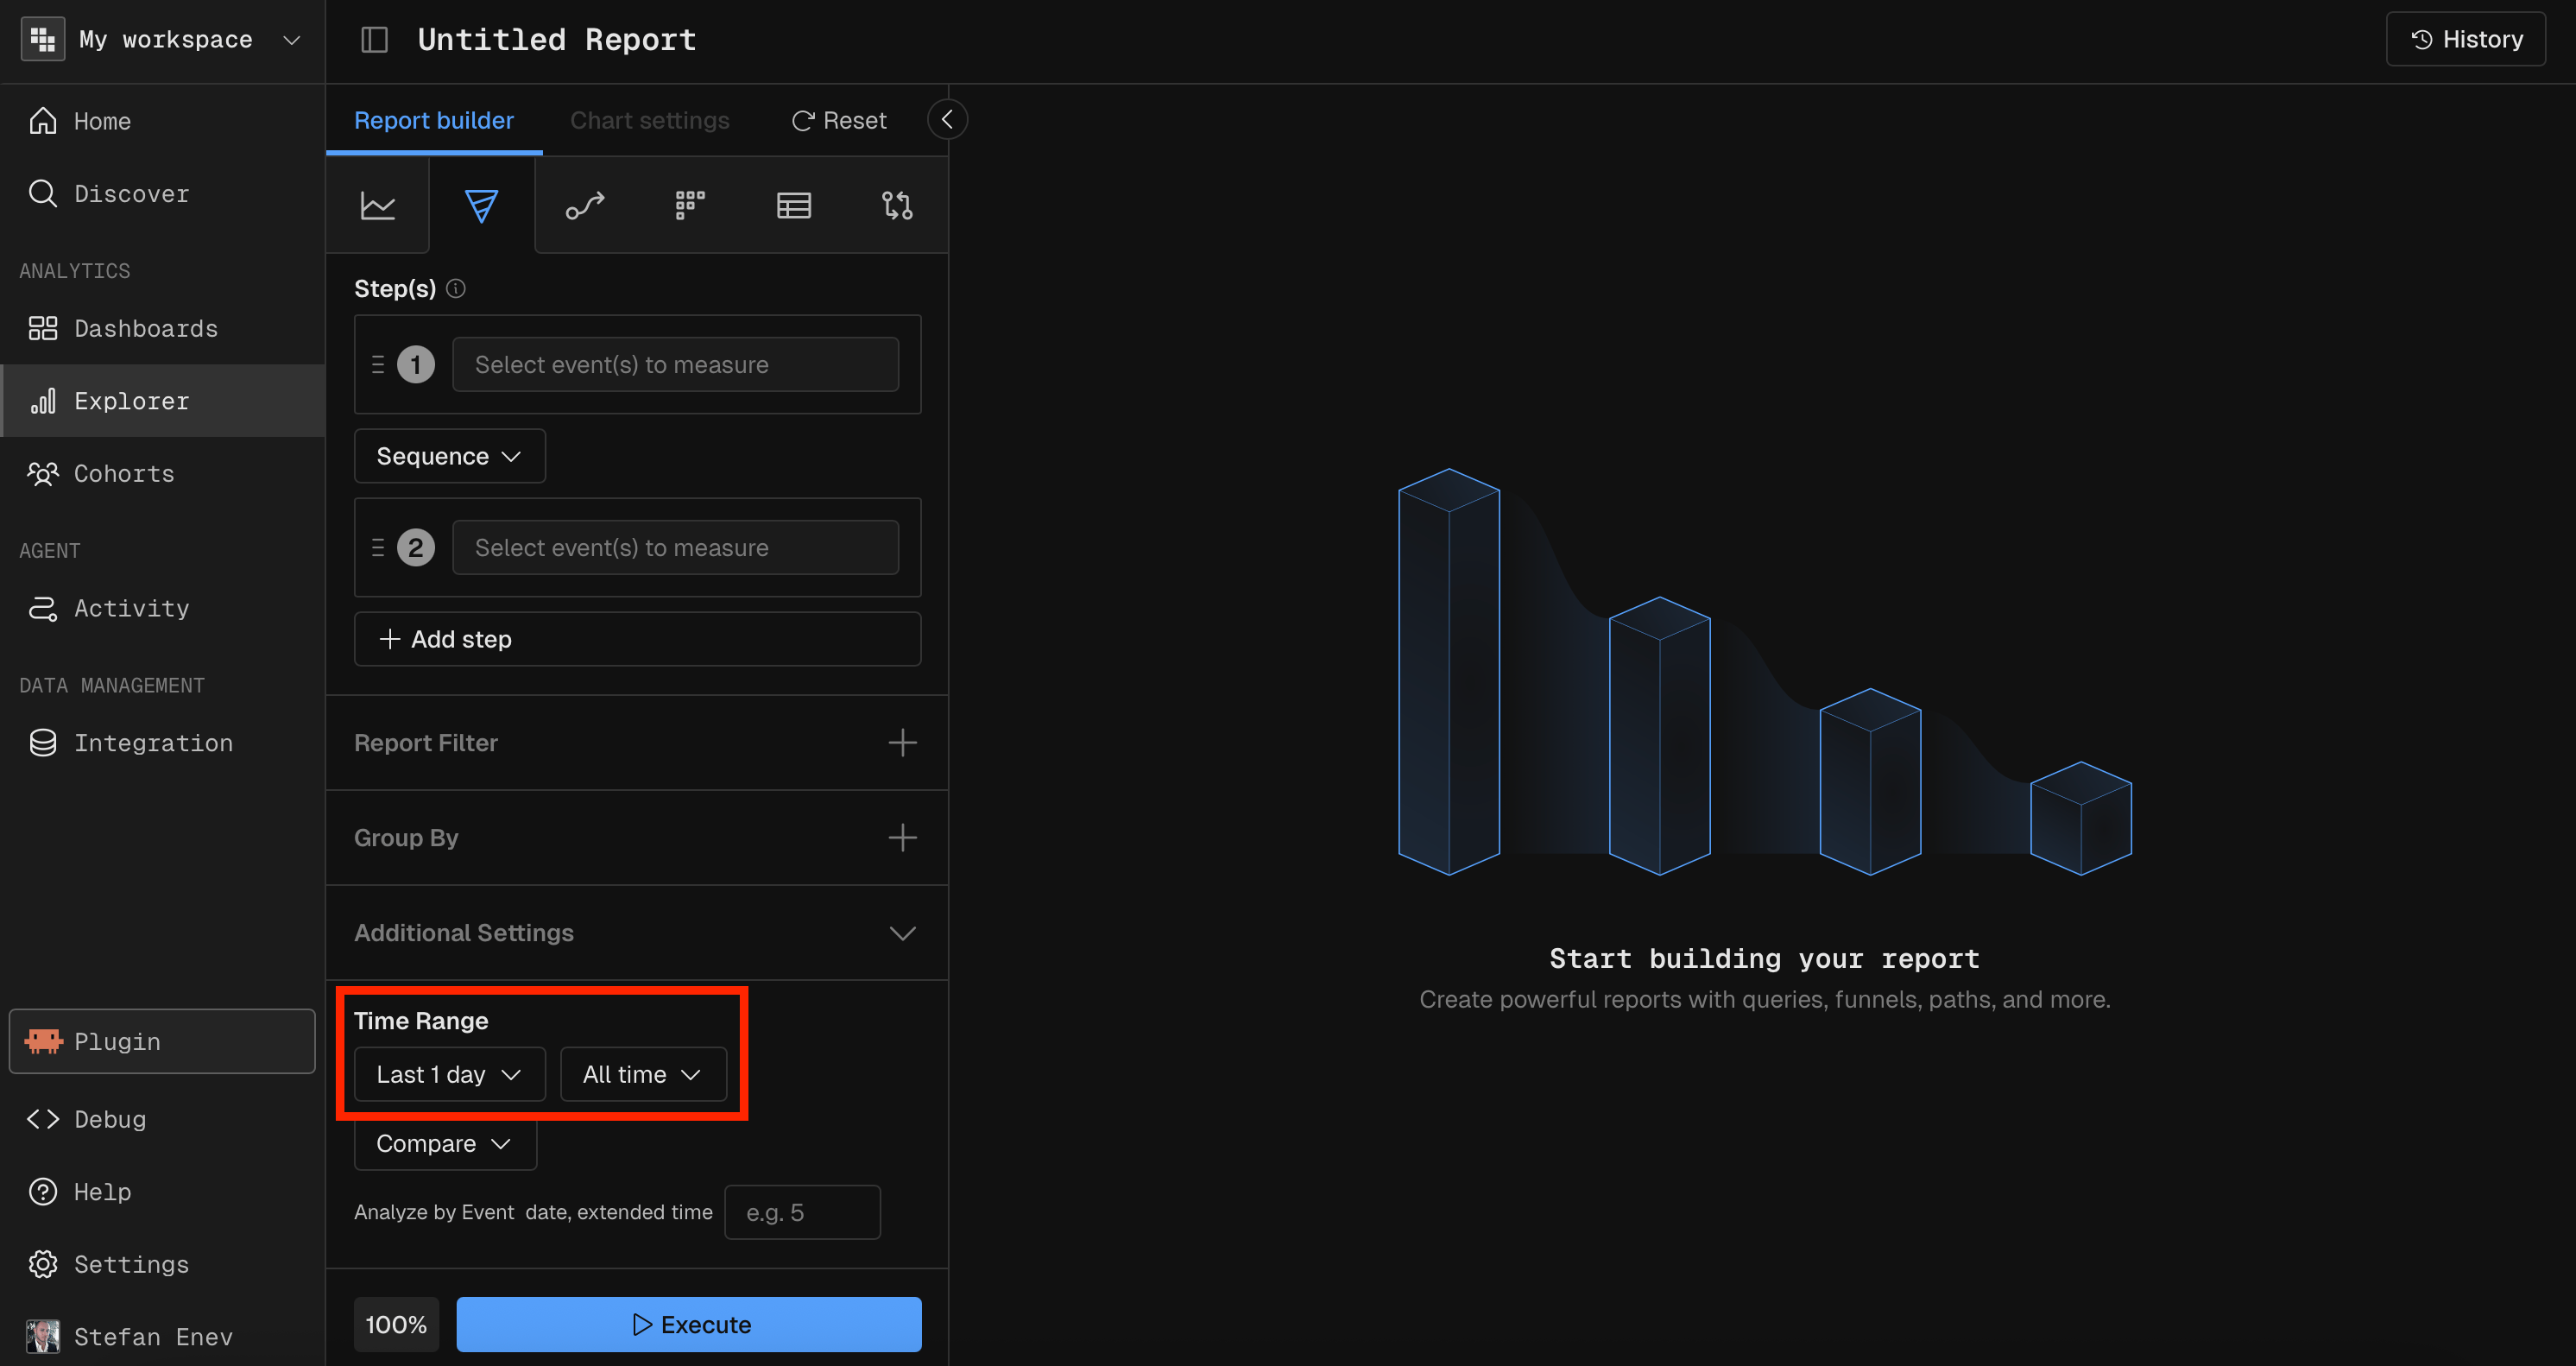
Date range
The date range sets which dates the report includes. Five options are available, and each suits reports you add to dashboards in a different way.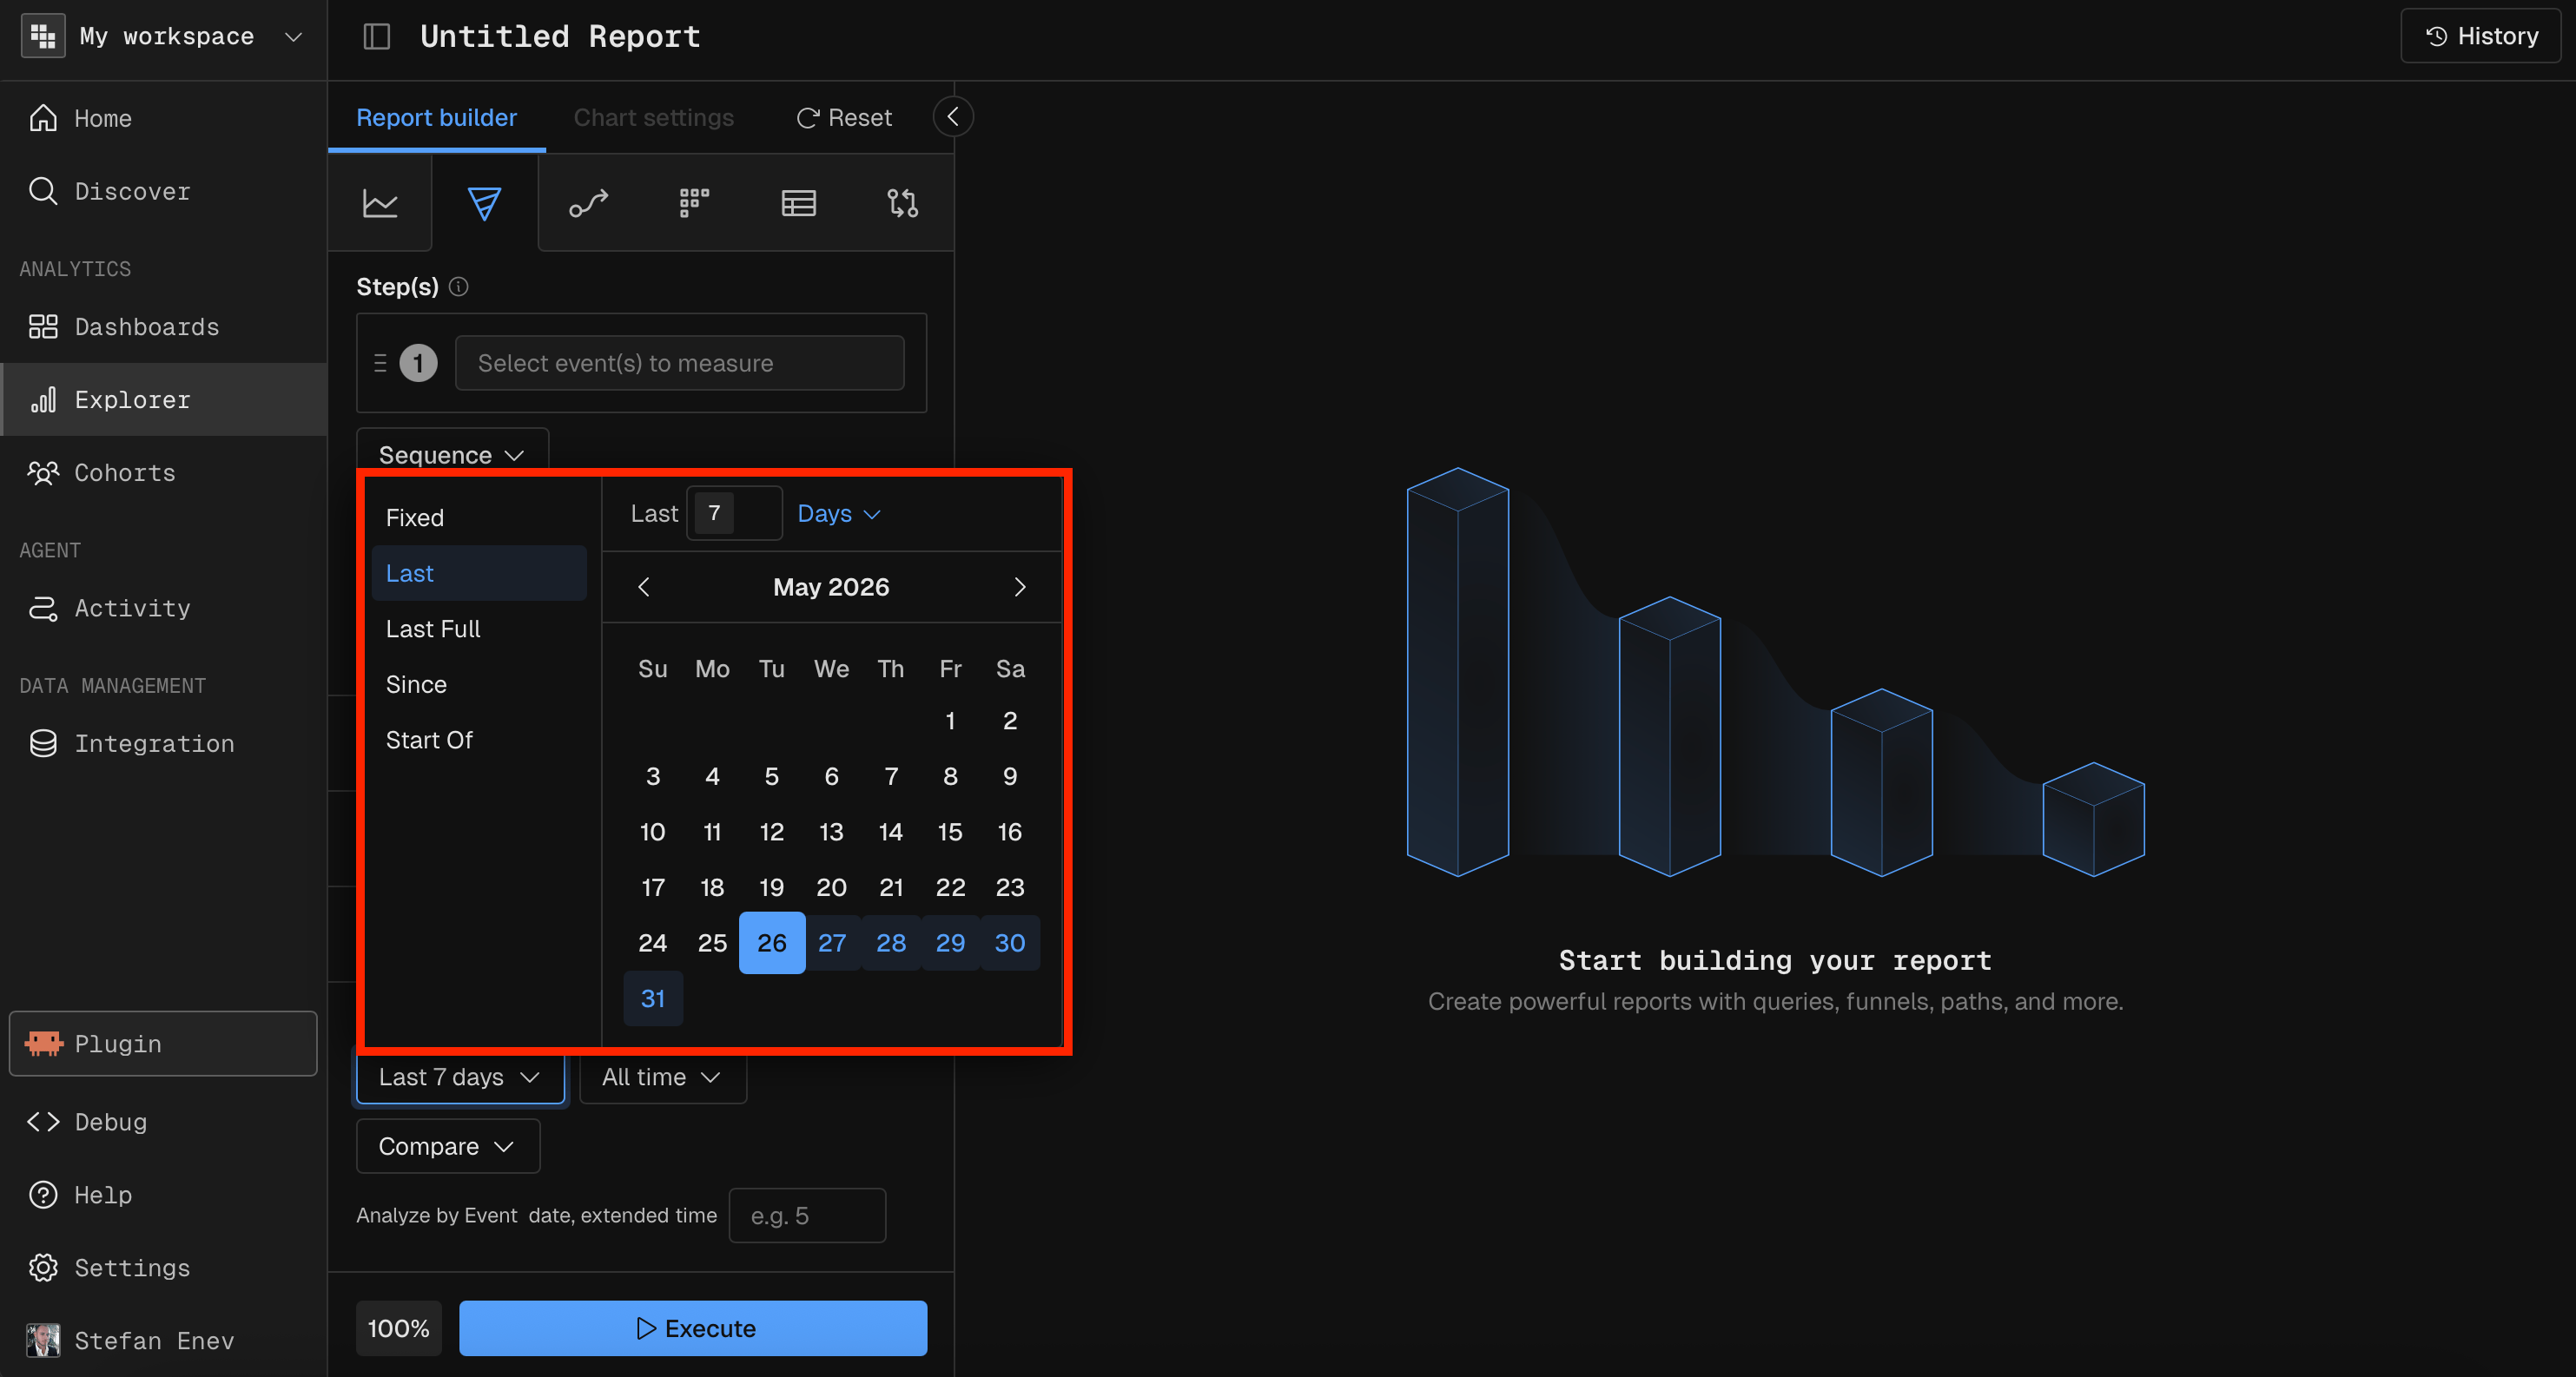
Include Missing Dates
Include Missing Dates is on by default. When it’s on, the report adds zero-value data points for dates with no matching events. When it’s off, the report skips dates with no data.MCP prompt examples
“Show me daily sessions for the last full week”
“Count checkout events since Oct 1, 2026, by day”
Time unit
The time unit sets the interval Kubit aggregates data over. The interval you pick sets the number of data points on the chart in Query, Funnel and Retention reports.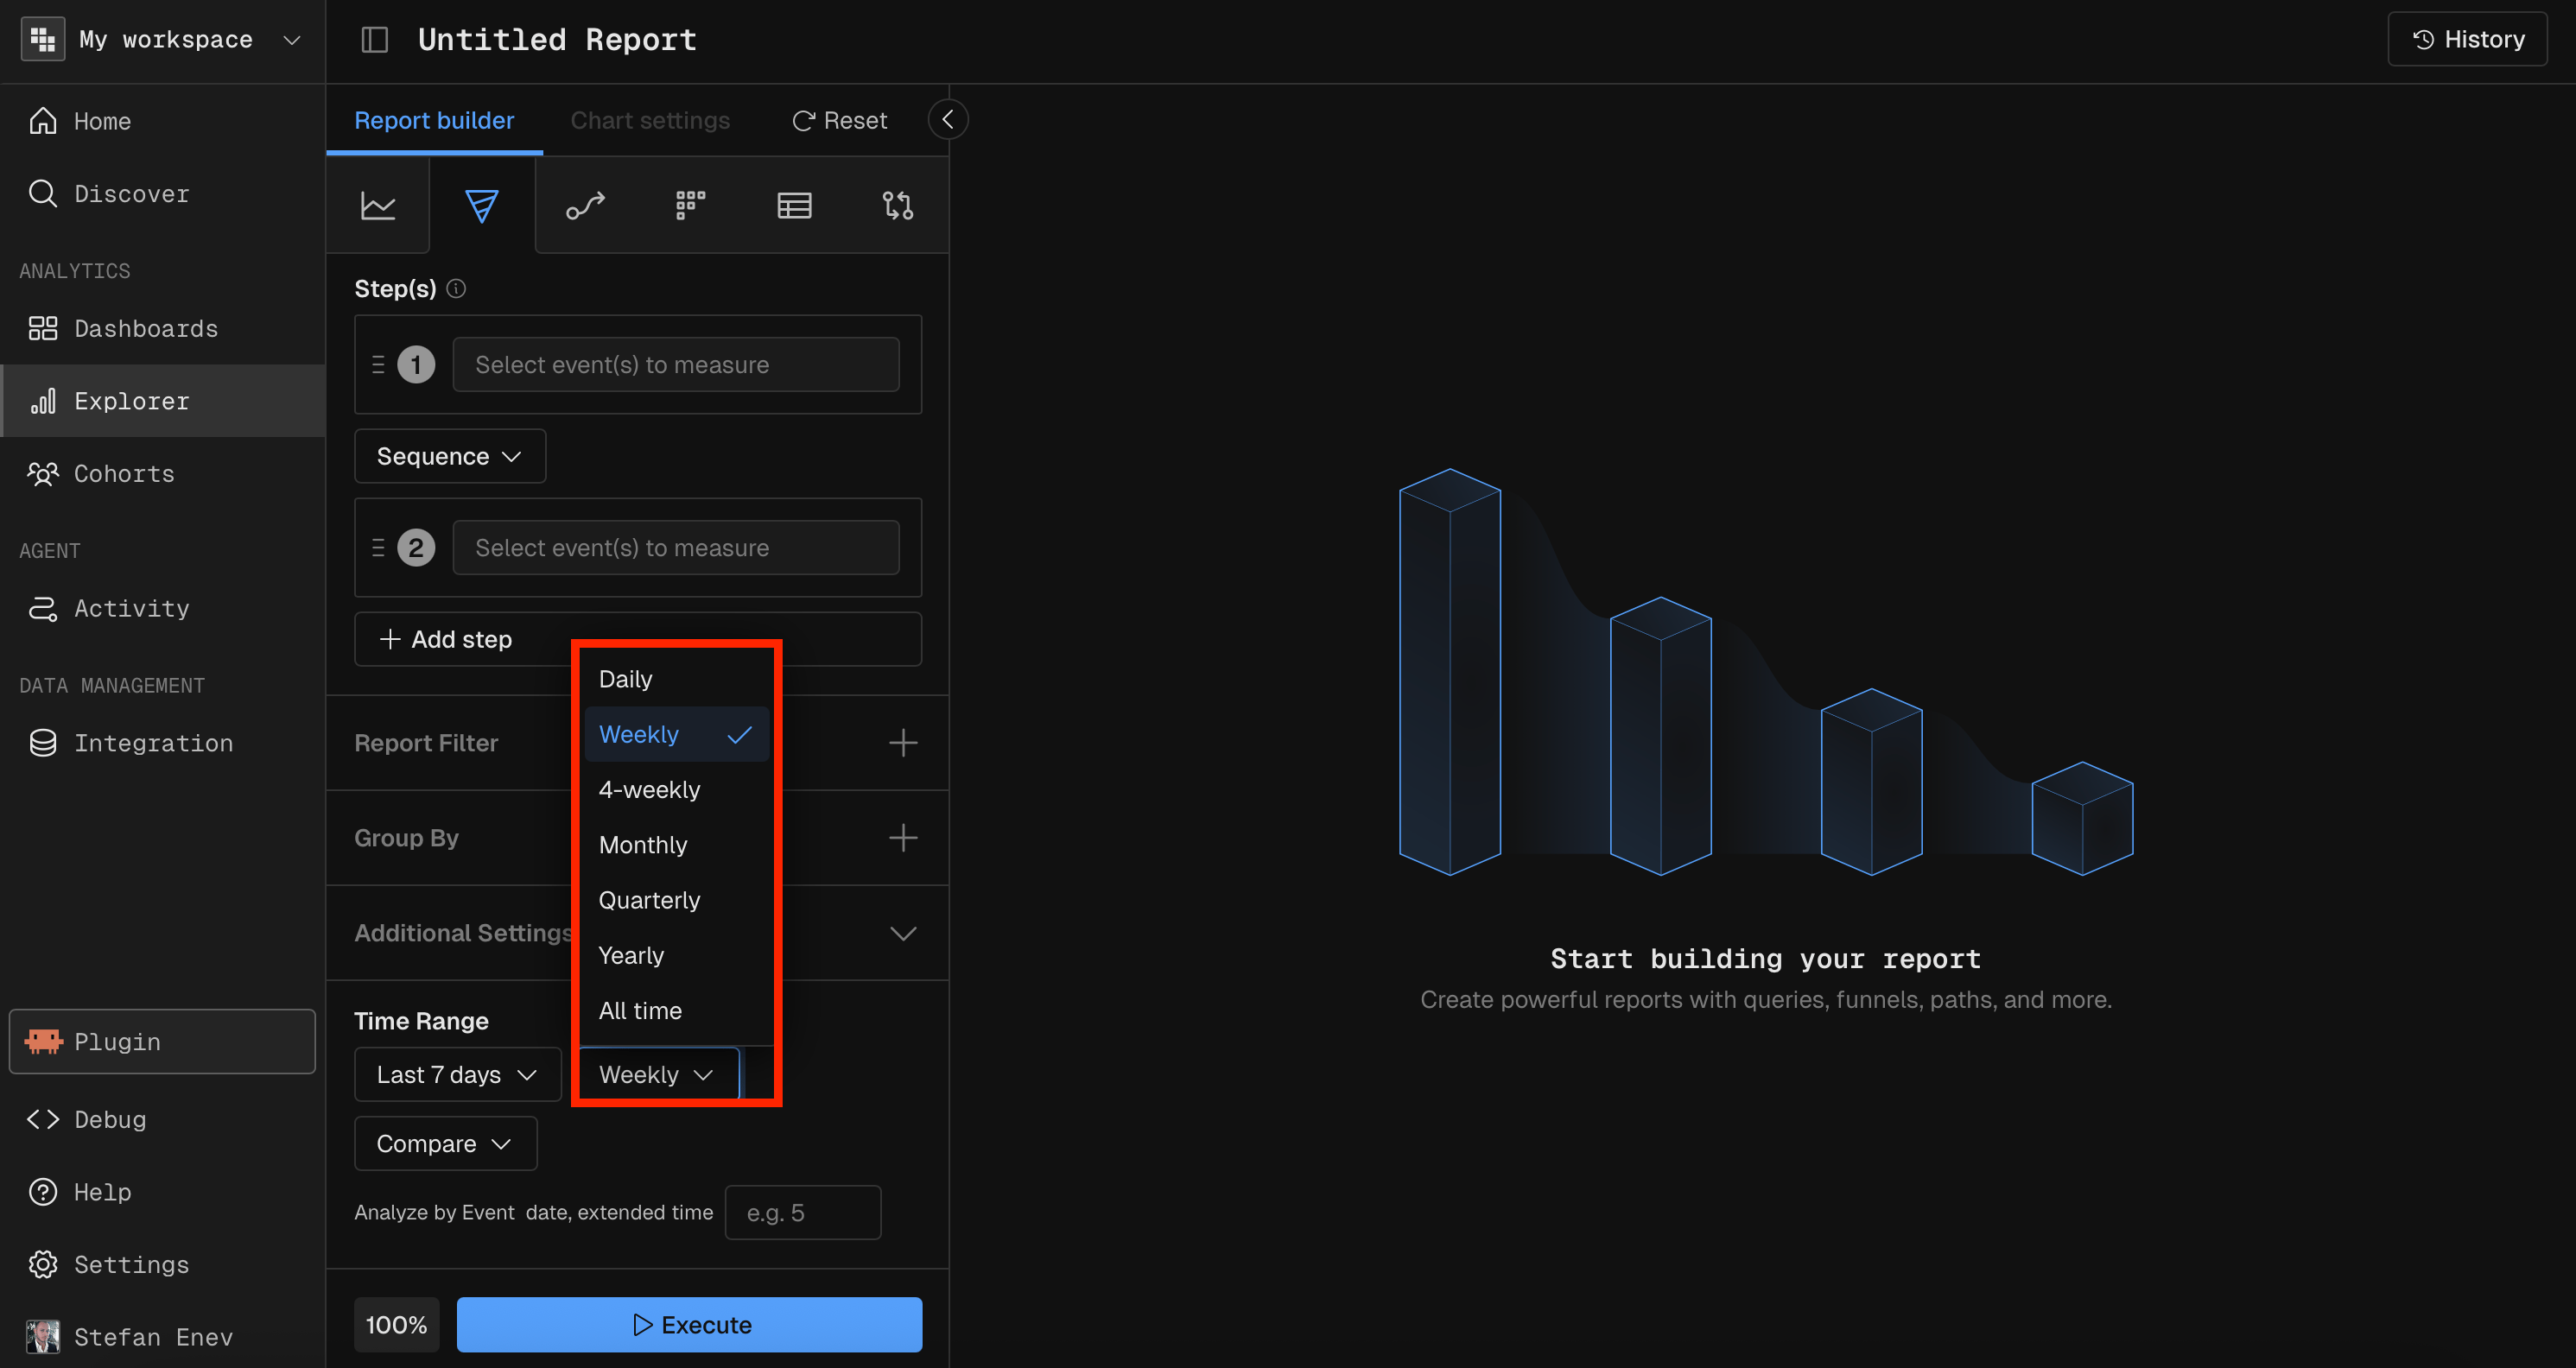
Event Month or Event Day as a breakdown.
Allowed time units by report type
MCP prompt examples
“Show weekly active users for the last 3 months”
“Build a monthly retention report for users who signed up this year”
Related
- Compare: overlay a prior period on the same report.
- Reports overview: the report types that use these settings.