

Before you start
- Traces in one of the tools under Export from your tool, and access to export them
- A Kubit account that can create workspaces, in an organization with Sandbox turned on. See Set up your organization.
- For the commands below:
jq1.7 or later, and the tool’s own CLI where a section names one
Prompt for your coding agent
Paste this into Claude Code, Cursor or Codex, with your tool in place of<tool>. It writes the file and leaves credentials and the upload to you:
Steps
Export your traces
Export the traces to one file with the commands for your tool under Export from your tool. Kubit reads the format from the file, so keep the records as the tool writes them.
Create a Sandbox workspace
In Kubit, open the workspace menu at the top left and click New workspace. Enter a Workspace Name, set Origin to Sandbox and click Continue.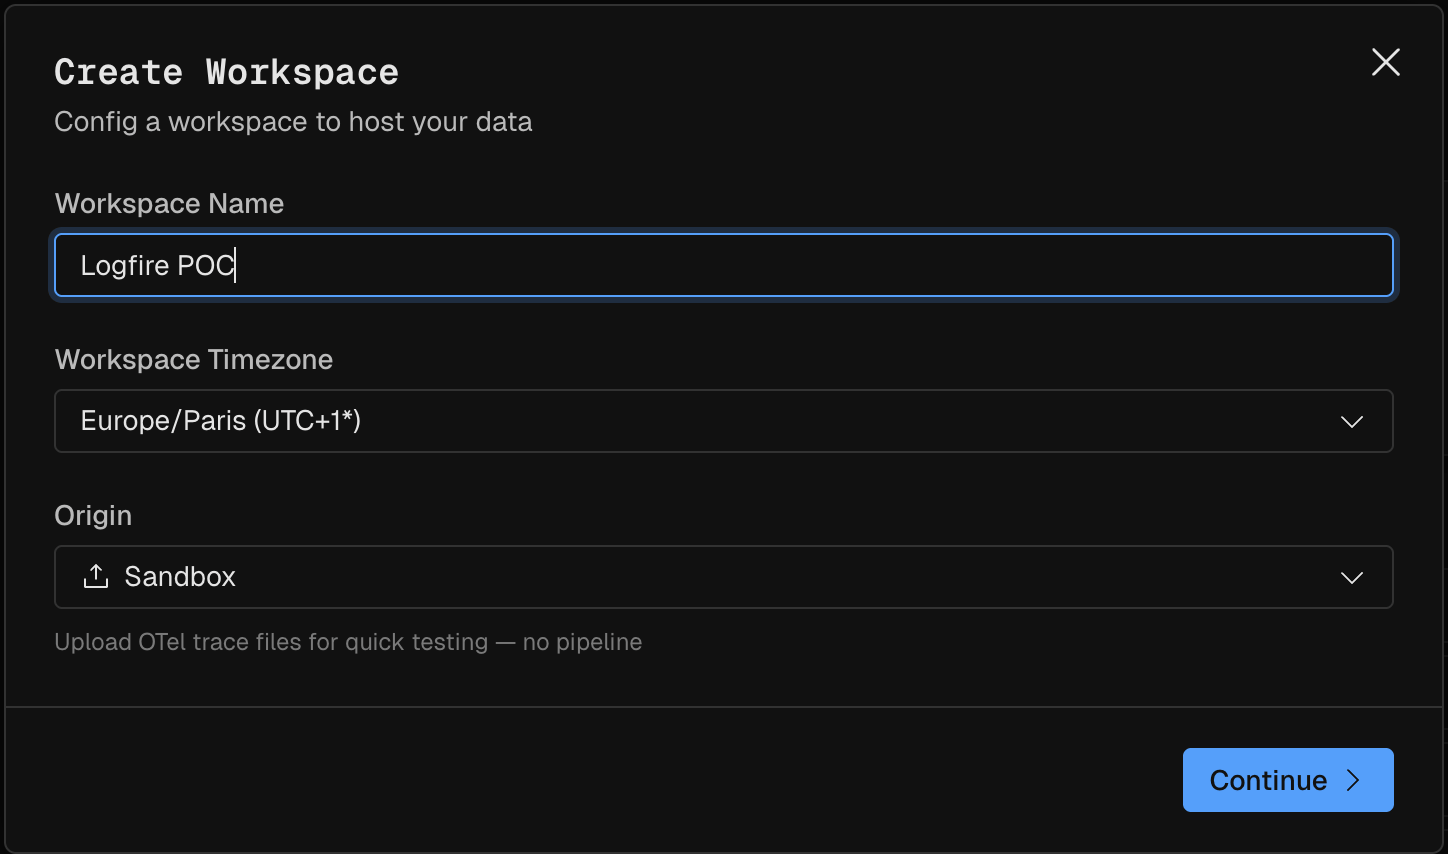
Upload the file
Drag the file onto Drop a trace file here, or click browse and pick it. In a workspace that already has uploads, click Add data first. Then click Upload & preview and keep the browser tab open until the upload reads 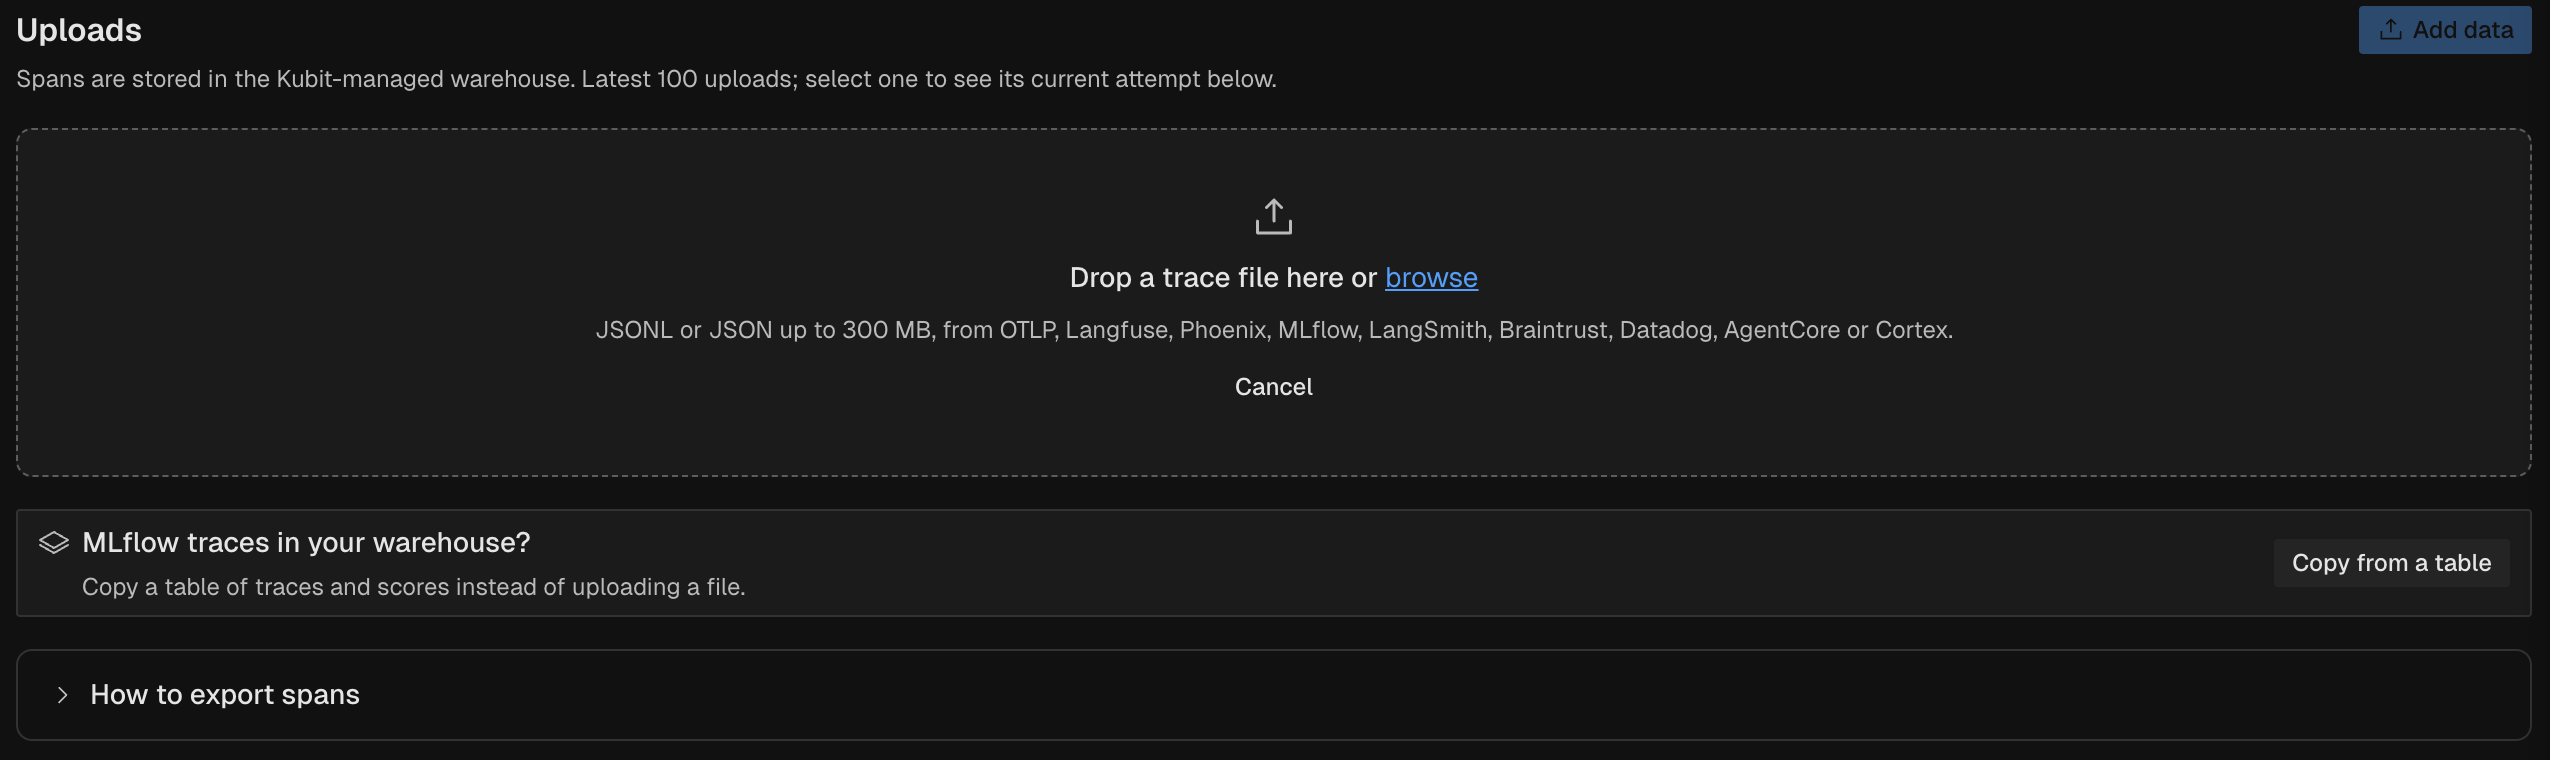
Uploaded. Ready to review.Check the preview
Kubit reads a sample from the start of the file and shows a preview. Check these:
If the preview says
The records match more than one format. Each is read as its own unless you choose one., pick your tool under Format.Import the spans
Under After import, pick what labels the traces:
Tick I reviewed the sample and the data model. and click Import spans. The import runs through Checking the file, Reading spans, Saving to the warehouse and Preparing reports. You can leave the page while it runs.When it’s done, the upload reads Succeeded, with these counts:
Add a labels file (optional)
To use labels or scores you already have instead of the Evaluator’s, click Add labels file in the upload’s Labelling section. Drop the file on Drop a labels file here, click Upload labels file, review it and click Apply labels. Each tool’s section below says where its labels come from.A label names what happened, such as
tool_error. A score from 0 to 1 answers an enabled Evaluator question, such as resolved. A pass, fail, yes or no is named after its check, as in relevance_fail. True adds <name>, false adds <name>_false.Export from your tool
Each section has the export the How to export spans section in the app shows for that tool. The upload drop zone lists the same tools by their short names.OpenTelemetry (OTLP)
Save spans as OTLP JSON: one envelope or span per line, or a JSON array. The OpenTelemetry Collector’s file exporter writes this. Kubit skips a line over 4 MB. To split an envelope into single spans:Split OTLP envelopes into spans
traceId, spanId, startTimeUnixNano and endTimeUnixNano, with camelCase keys and hex IDs. Attributes must be typed, as in {"key": "gen_ai.tool.name", "value": {"stringValue": "search_orders"}}. Kubit maps the OpenTelemetry GenAI attributes (gen_ai.*). Labels and scores come from gen_ai.evaluation.result span events. For Pydantic Logfire, see Logfire traces in a Sandbox.
Langfuse
Kubit reads no labels from Langfuse trace files. Add them with a labels file of Langfuse scores. Export Enriched observations to blob storage as JSONL, with Gzip Compression off, then join the files. Legacy observations have no session, user or tags.Join Langfuse observation exports
cursor=<meta.cursor> until none comes back, and join the pages. Times are ISO 8601, such as 2026-10-01T00:00:00Z.
Langfuse observations API
Join the API pages
id, trace_id, type, start_time and end_time. For labels, export scores to blob storage the same way (cat scores/*.jsonl > scores.jsonl), download them from the Scores page as JSON, or call GET /api/public/v3/scores?fields=details,subject&limit=100. Boolean and categorical scores become labels, numeric scores answer an enabled Evaluator question, and text and correction scores are ignored.
Arize Phoenix
Select rows in a project’s Spans or Traces table, click the download icon, set Data to Traces and pick JSONL. OTLP JSON works too, up to the 4 MB record limit. Each record needscontext.trace_id, context.span_id, span_kind, start_time, end_time and status_code. Annotations in the file are read as labels.
MLflow
In Python with MLflow 3.5 or later, write each trace as one line of a.jsonl file. A trace over 4 MB can’t be read. On Databricks with Unity Catalog storage, first set MLFLOW_TRACING_SQL_WAREHOUSE_ID to a SQL warehouse ID.
export_mlflow_traces.py
trace_id, request_time, and spans or assessments, and it’s copied once.
LangSmith
Kubit reads no labels from LangSmith trace files, because a run carries only feedback totals. Add labels with a labels file of LangSmith feedback. Export with the LangSmith CLI, then join the files. The CLI keeps at most 1,000 runs per trace.Export LangSmith runs
POST /api/v2/runs/query and join the pages with jq -c '.items[]' *.json > runs.jsonl. Without min_start_time, only the last 24 hours come back. Each run needs trace_id, id, run_type, start_time and end_time. For labels, save the project’s feedback from GET /api/v1/feedback?session=<project id>&limit=100&offset=<N>, one record per line.
Braintrust
Delete any oldbt-sync folder, then pull the logs with the bt CLI and join the part files. Without --traces, it takes 100 traces.
Export Braintrust logs
root_span_id, span_id, metrics.start and metrics.end. Scores and classifications in the file are read as scores and labels.
Datadog LLM Observability
Call the export API withDD-API-KEY and DD-APPLICATION-KEY (with curl, add -g). Save each page as page1.json, page2.json and so on, asking for the next with page[cursor]=<meta.page.after> until it’s missing. Without a range, it returns the last 15 minutes.
Datadog spans export API
Join the pages
trace_id, span_id, span_kind, start_ns and duration. Each span’s evaluation is read as labels and scores.
AWS Bedrock AgentCore
Kubit reads no labels from AgentCore trace files. Add them with a labels file of evaluation results. Save the agent’s spans log stream as it is, then split it if it’s over 4 MB:Export AgentCore spans
UNIFIED_TRACES_DESTINATION_ENABLED=false, read aws/spans too, with --log-group-name aws/spans --log-stream-names default --start-time <ms> --end-time <ms>. That group holds no prompts or replies. For labels, read the evaluation results group, by default /aws/bedrock-agentcore/evaluations/results/<config id>.
Snowflake Cortex
In SnowSQL or the Snowflake CLI, not a worksheet, unload the agent’s events to one JSONL file and download it.<dir> is a full path, such as /Users/me/Downloads.
Unload Cortex Agent events
MONITOR on the agent, or USAGE on an External Agent, and the SNOWFLAKE.CORTEX_USER database role. Without READ UNREDACTED AI OBSERVABILITY EVENTS TABLE, prompts and replies come out redacted. For a TruLens app, use 'EXTERNAL AGENT'. Evaluations in the events are read as scores. Thumbs feedback isn’t read yet.
Verify
The upload worked when all three are true:- The upload in Modeler > Uploads reads Succeeded, and Spans imported plus Duplicates and Skipped add up to the spans you exported.
- Activity lists your traces, with the span names you know from your tool.
- After the Evaluator runs, Labels shows labels instead of
Not analysed yet.
If it fails
Next Steps
- Logfire traces in a Sandbox: the whole flow worked through on a Pydantic Logfire project.
- Add your own eval questions: ask your own questions of every uploaded conversation.
- Quickstart: send live traces to an Agent workspace.