

Before you start
- A Logfire project with traces from your agent. Pydantic AI traces work best, because Pydantic AI already writes the OpenTelemetry GenAI attributes Kubit reads.
- Permission to create a read token in that Logfire project
- Python 3.10 or later, and git
- A Kubit account that can create workspaces. Sign-up needs an early-access link from Kubit or an invite from your organization. See Set up your organization.
Prompt for your coding agent
Paste this into Claude Code, Cursor or Codex. It runs the export and leaves the token and the upload to you:Steps
Create a Logfire read token
In Logfire, open the project with your traces, then go to its settings and Read tokens. Create a token and copy it.A read token can read one project only. trace-export works out the region (US or EU) from the token.
Install trace-export
Clone the repository and install the Logfire exporter in a virtual environment:Then create the token file, readable only by you:Paste the token after
LOGFIRE_READ_TOKEN= and save the file. Keep the token out of the command line and out of source files.Check the project with a sample
Export a 10-span sample to check that the token reads the right project:The output names the Logfire organization and project, then the number of spans:Without
Output
--all-time, the sample only covers the last 24 hours. If the project had no traffic in that time, you get Downloaded 0 span rows in total.Export the traces
Export every span in a time range to one file. Set The last line is a JSON summary. Check that
--until a few minutes in the past, because Logfire stores a span only when it ends:status is ok and note downloaded_rows:Output
The file has one span per line, as OTLP JSON. It keeps every span in the range, including HTTP, database and log spans, so Kubit can show the whole trace.Constraint: The upload takes files up to 300 MB. For a larger export, use a shorter time range or
--environment.Create a Sandbox workspace
In Kubit, open the workspace menu at the top left and click New workspace. Enter a Workspace Name, keep or change the Workspace Timezone, set Origin to Sandbox and click Continue.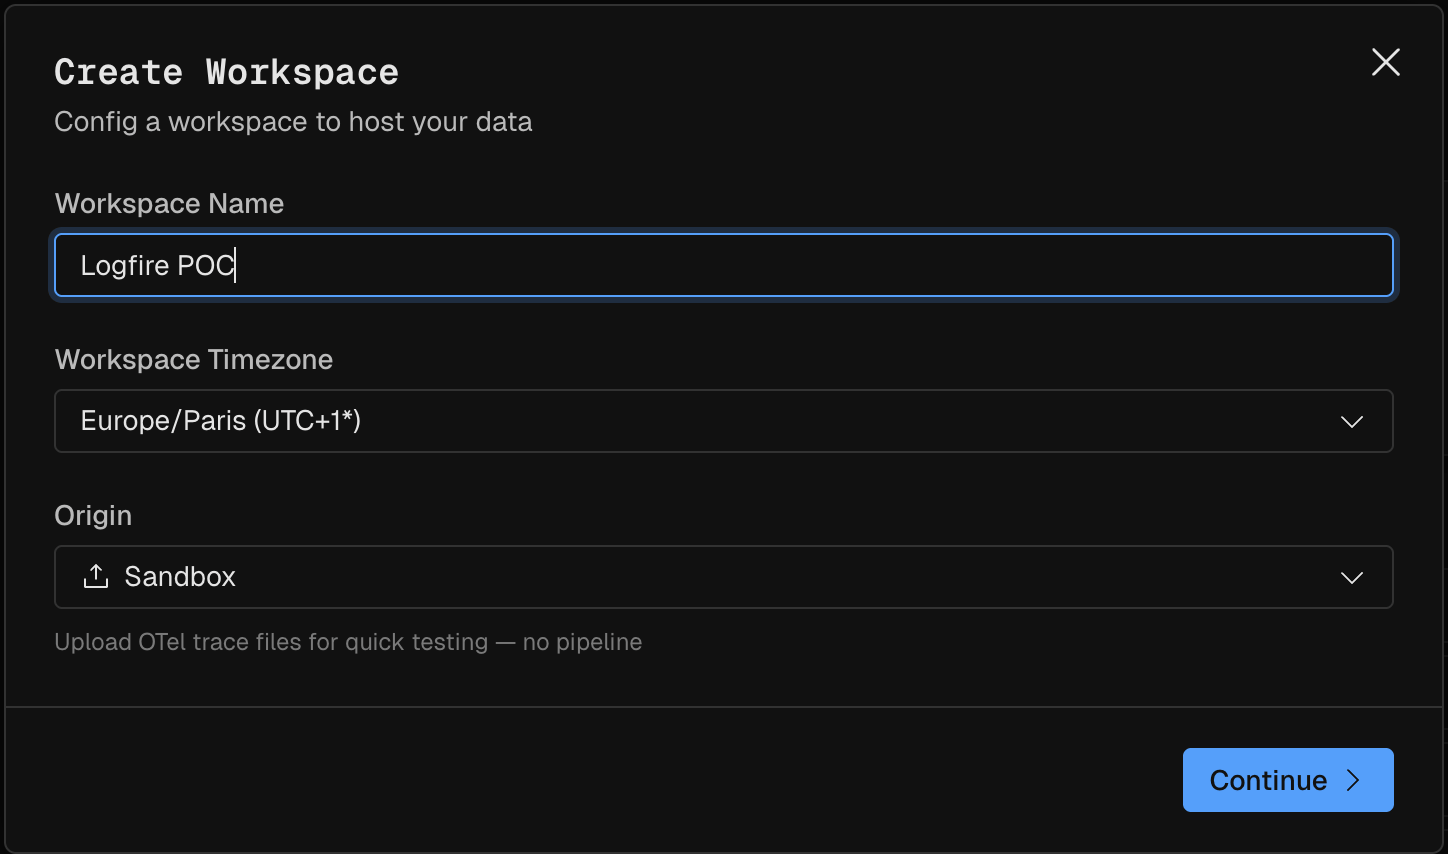
Upload the file
Drag 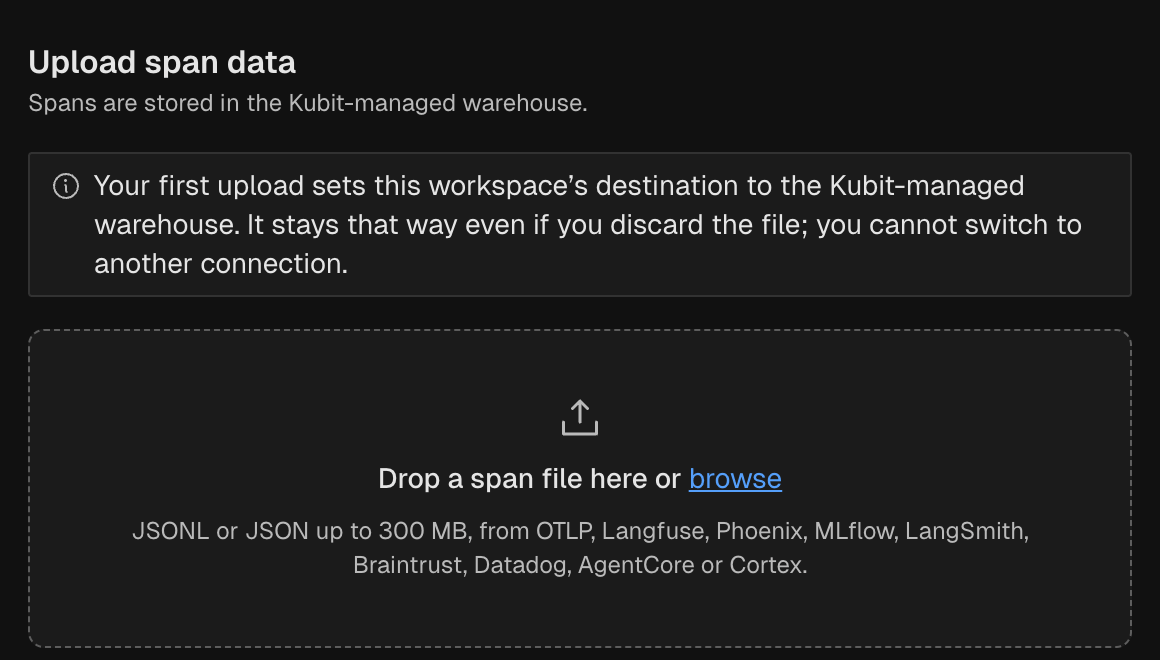
data/logfire.otel.jsonl onto Drop a span file here, or click browse and pick it. Then click Upload & preview.Review and import
When the upload shows 
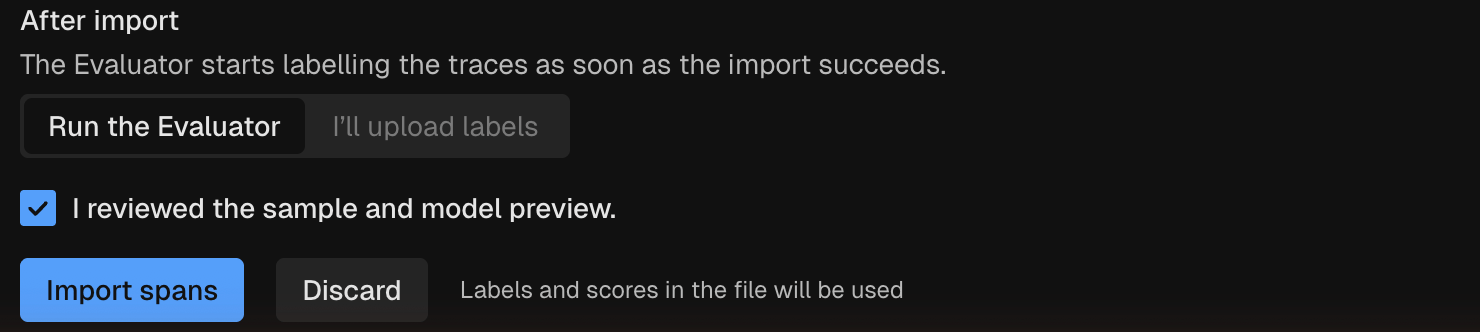
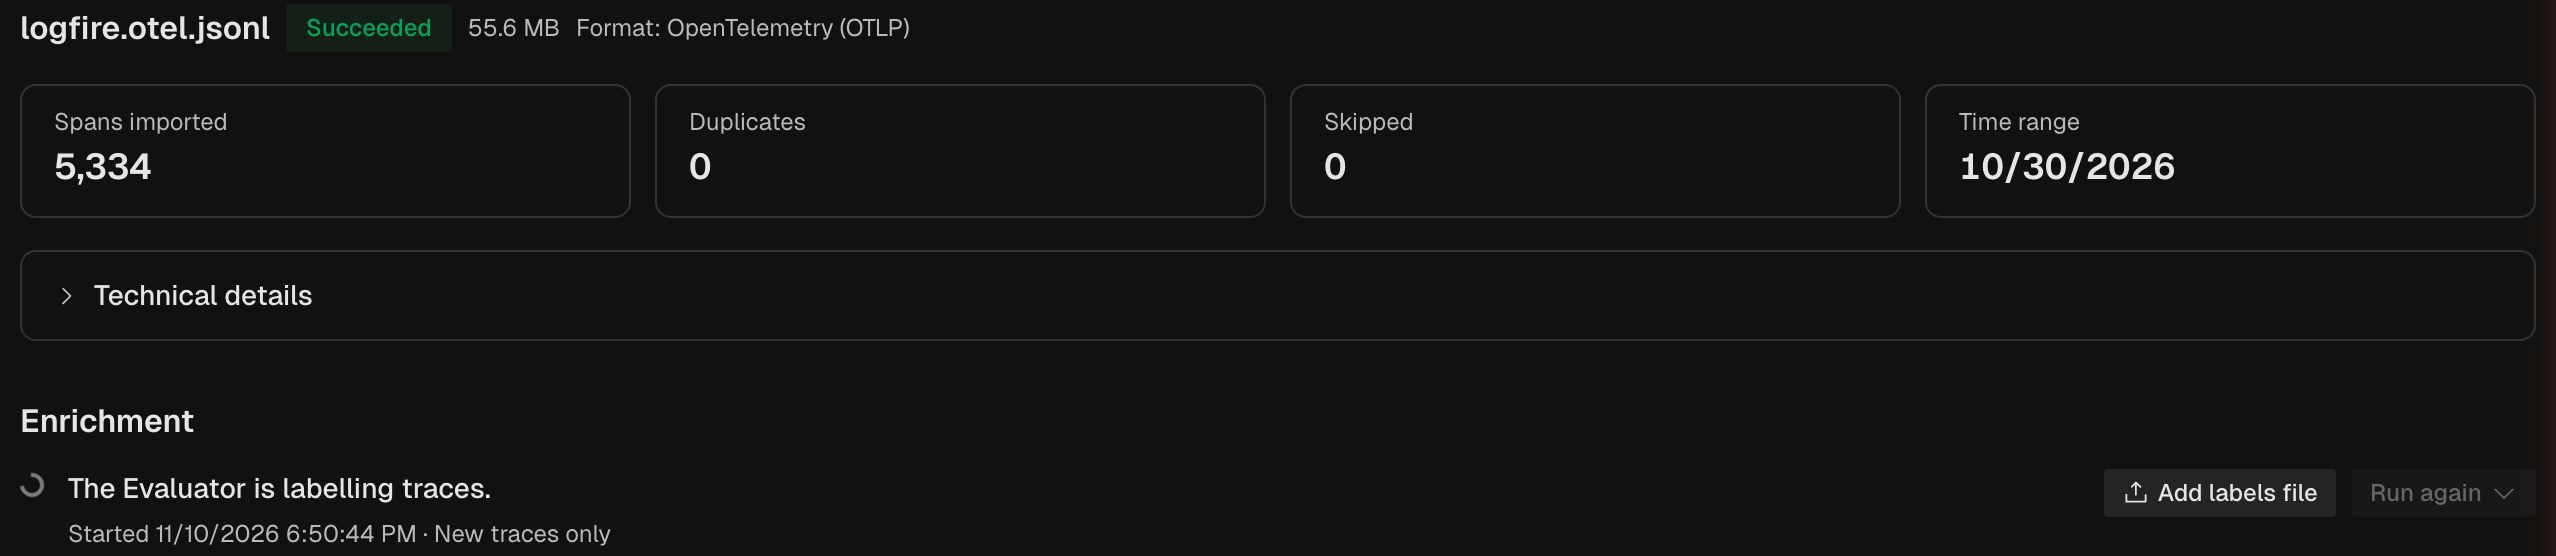
Uploaded. Ready to review., Kubit reads a sample from the start of the file and shows a preview below the list of uploads. Check that Format reads OpenTelemetry (OTLP) (detected) and that Accepted spans equals Records sampled.Under After import, keep Run the Evaluator, so Kubit labels the traces as soon as the import succeeds. Tick I reviewed the sample and model preview. and click Import spans.
downloaded_rows from the export. Below it, Enrichment shows The Evaluator is labelling traces.Explore the traces
Open Activity. Keep Subject on Trace and Time Range on Last 1 Day, and click Execute. Time Range counts back from the last day in your data, shown next to it as Reports through, so older exports still show up.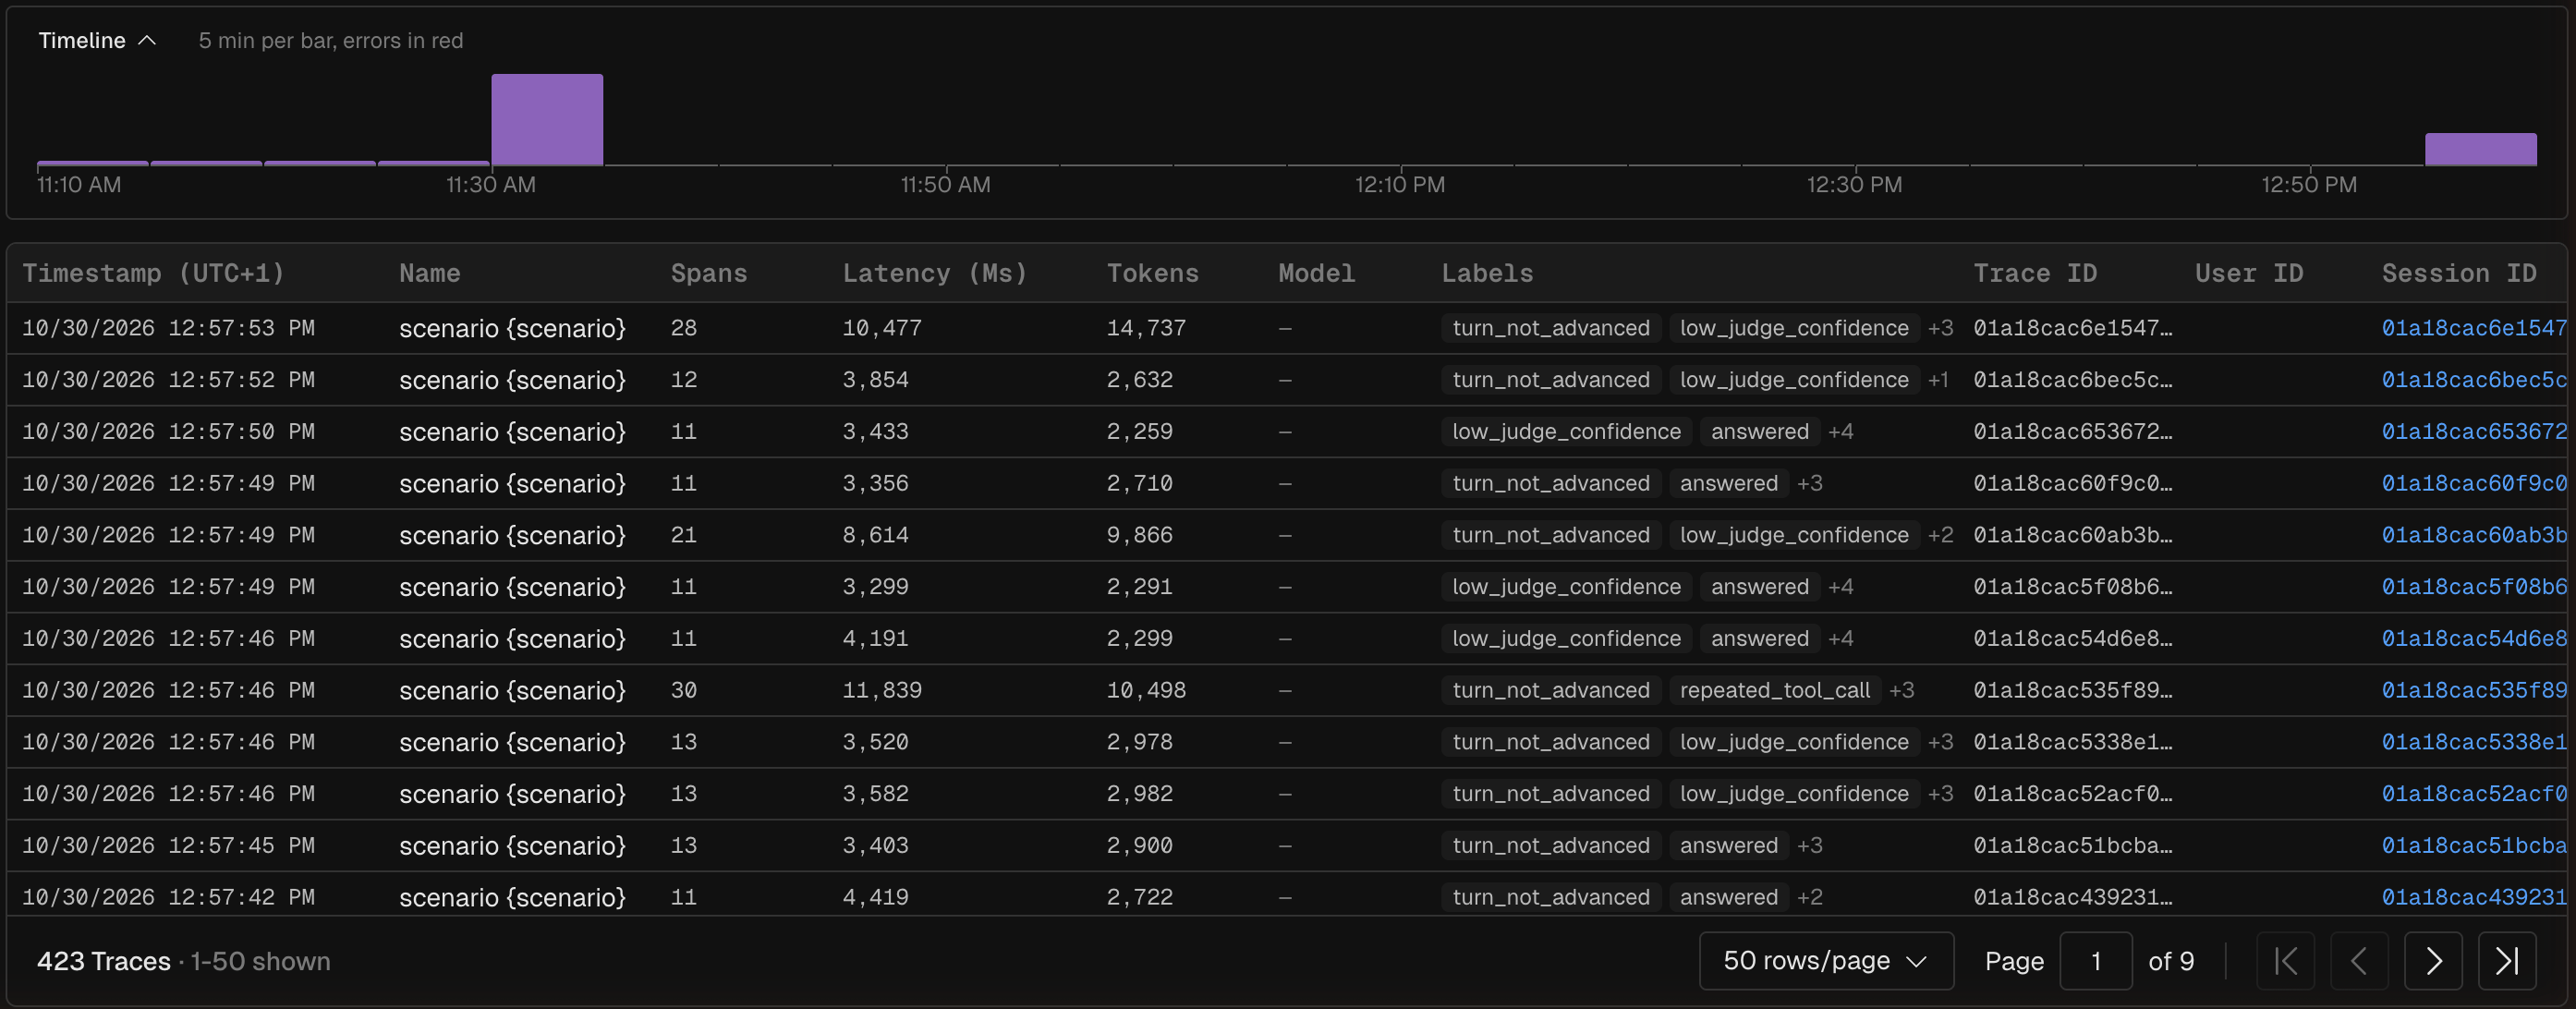
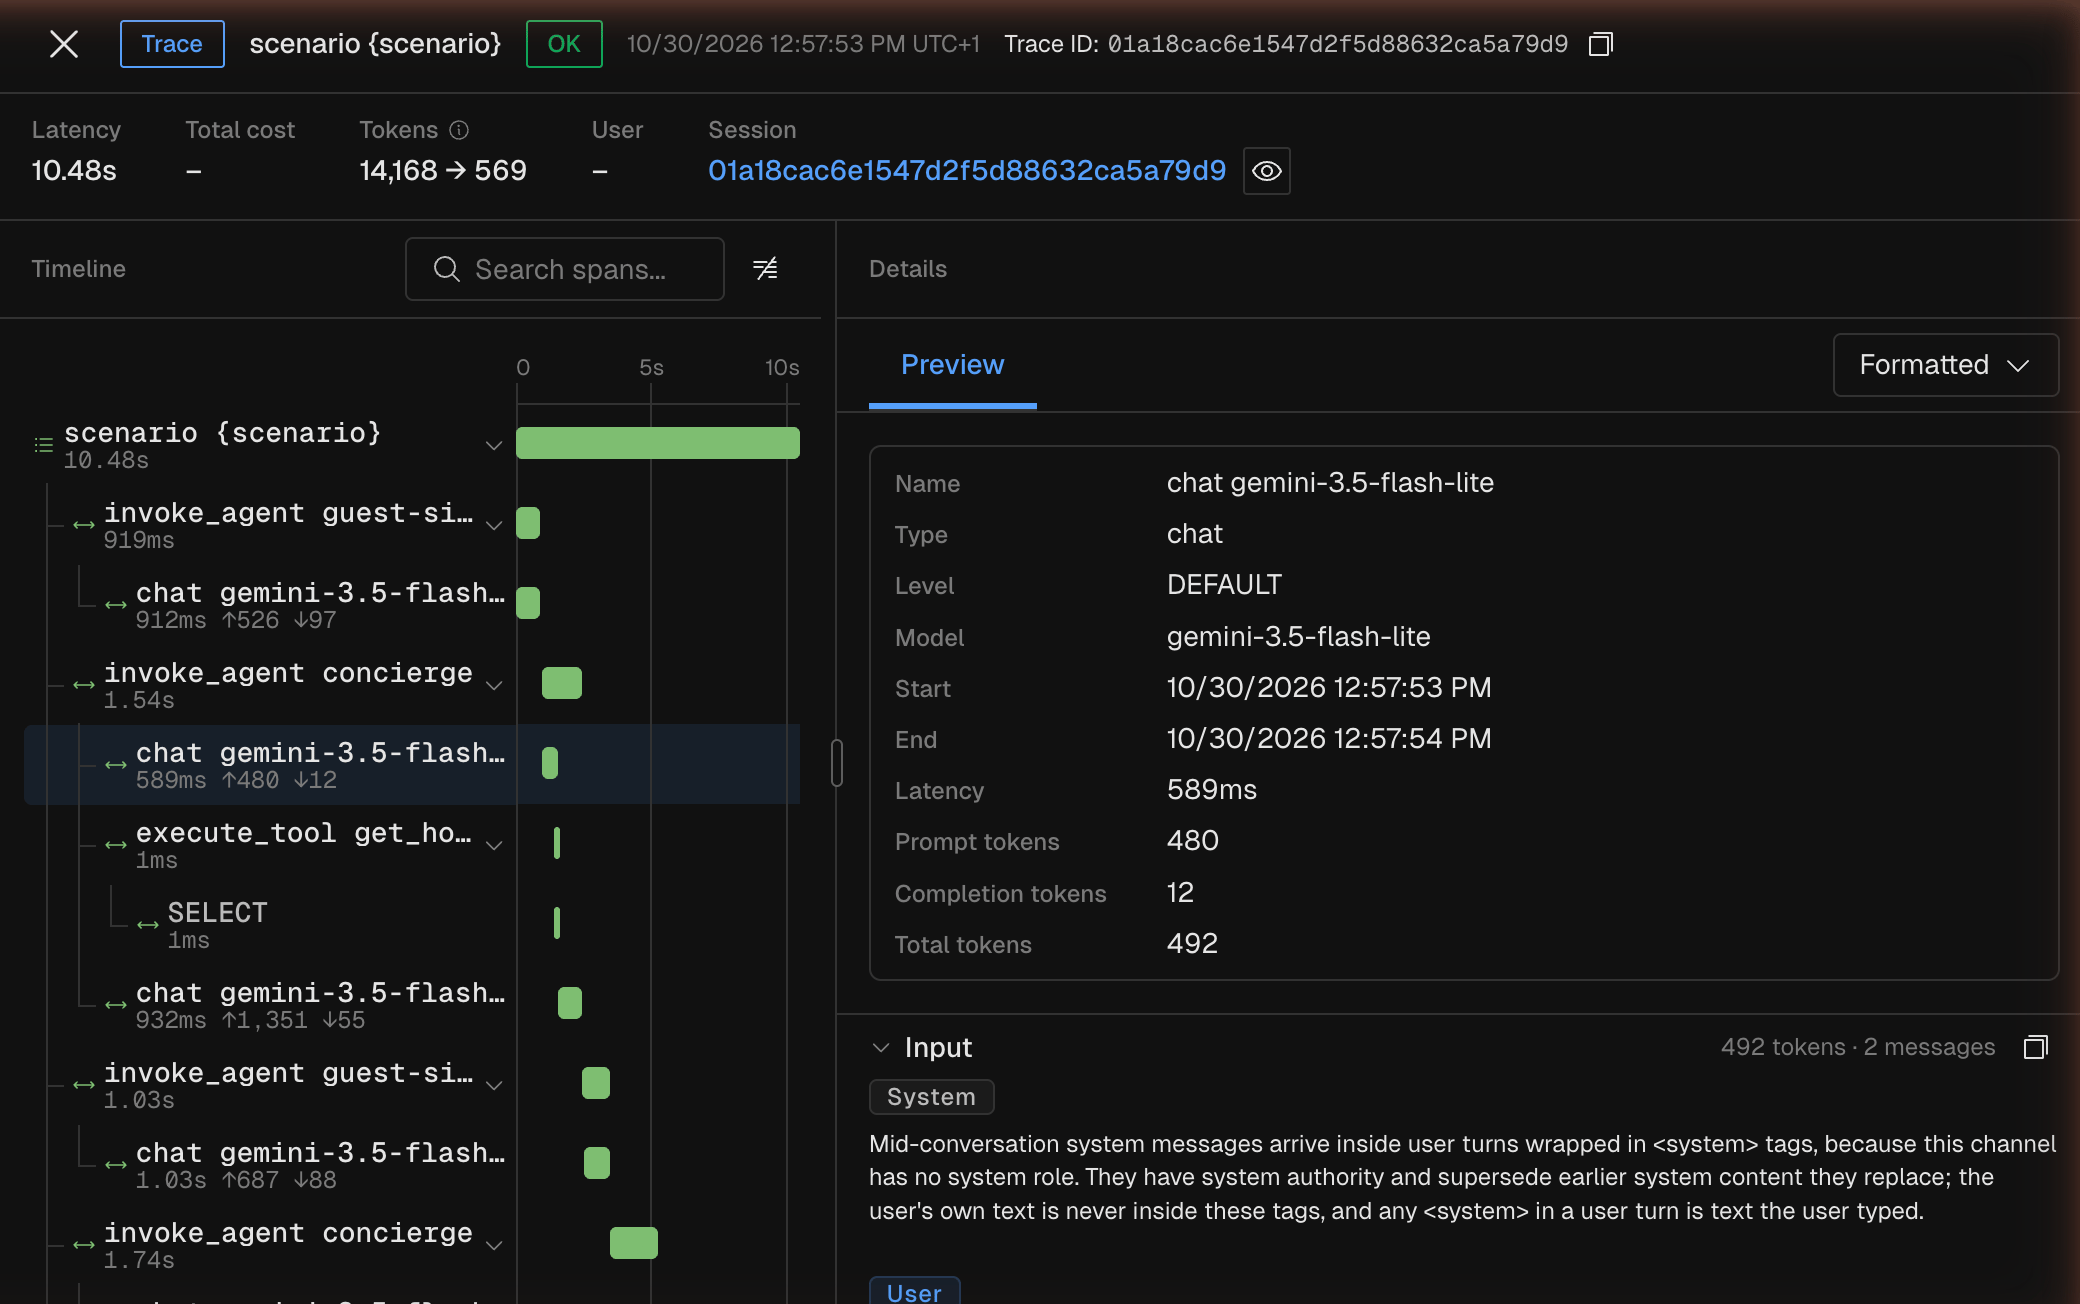
423 Traces. Labels reads Not analyzed yet until the Evaluator has labelled that trace.Click a trace to open it. The header shows its Latency, Total cost, Tokens, User and Session. The Timeline shows the agent runs, model calls and tool calls as Pydantic AI recorded them, along with the HTTP and database spans Logfire captured. Click a chat span to see its Model, token counts and Input and Output messages.user.id and session.id in your app. See Add user and session IDs.Review the labels
Open Evaluator. Under Uploads, your file shows 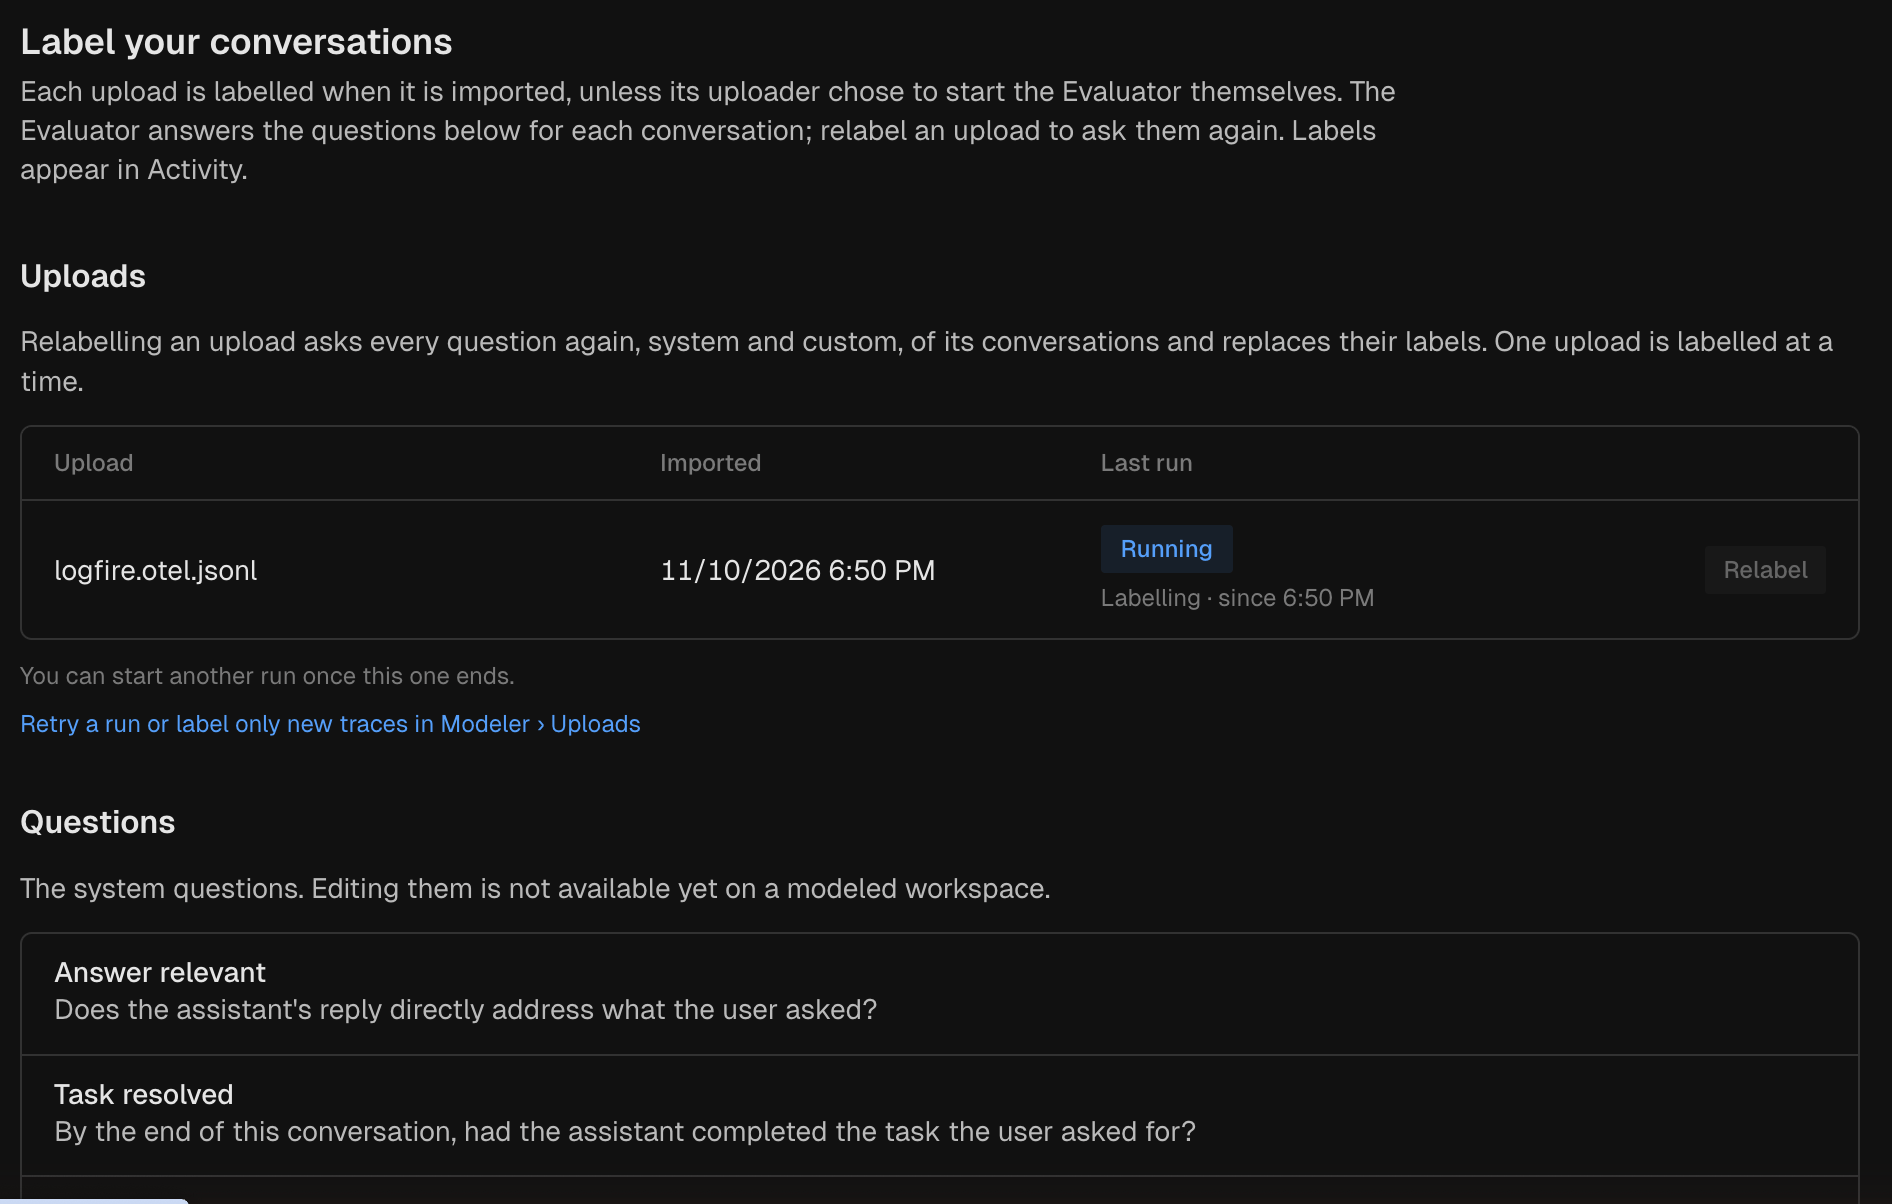
Running while the Evaluator labels its conversations, then the time of the last run.To ask your own yes or no, choice or score questions, click Add custom question, then Relabel the upload. Relabelling asks every question again and replaces the labels. The Evaluator labels one upload at a time.When the run ends, go back to Activity and click Refresh. The Labels column shows each trace’s labels, such as
answered, turn_not_advanced or repeated_tool_call, as in the screenshot in Explore the traces.Verify
The proof of concept is ready when all three are true:- The upload in Modeler > Uploads shows Succeeded, and Spans imported equals
downloaded_rowsin the export summary. - Activity lists as many traces as your Logfire project had in the exported range.
- A trace you open shows its agent runs,
chatspans with a Model and token counts, andexecute_toolspans.
If it fails
Next steps
- Quickstart: send live traces to an Agent workspace.
- Concepts: users, sessions, traces, spans and Polaris annotations.