

When to use
| Use case | Example |
|---|---|
| Finding where your agent fails | ”Where do shopping agent traces fail over the last week?” |
| You don’t know which report fits | ”Where do new users drop off during onboarding?” |
| Exploring step by step | Ask for a chart, then “break that down by plan”, then “only users from paid campaigns” |
| Finding existing work | ”Find reports about trial conversion” |
| Checking a spike or drop | ”Is there anything unusual in this report?” |
| Explaining a change | ”Why did activation drop last week?” |
Open Lumos
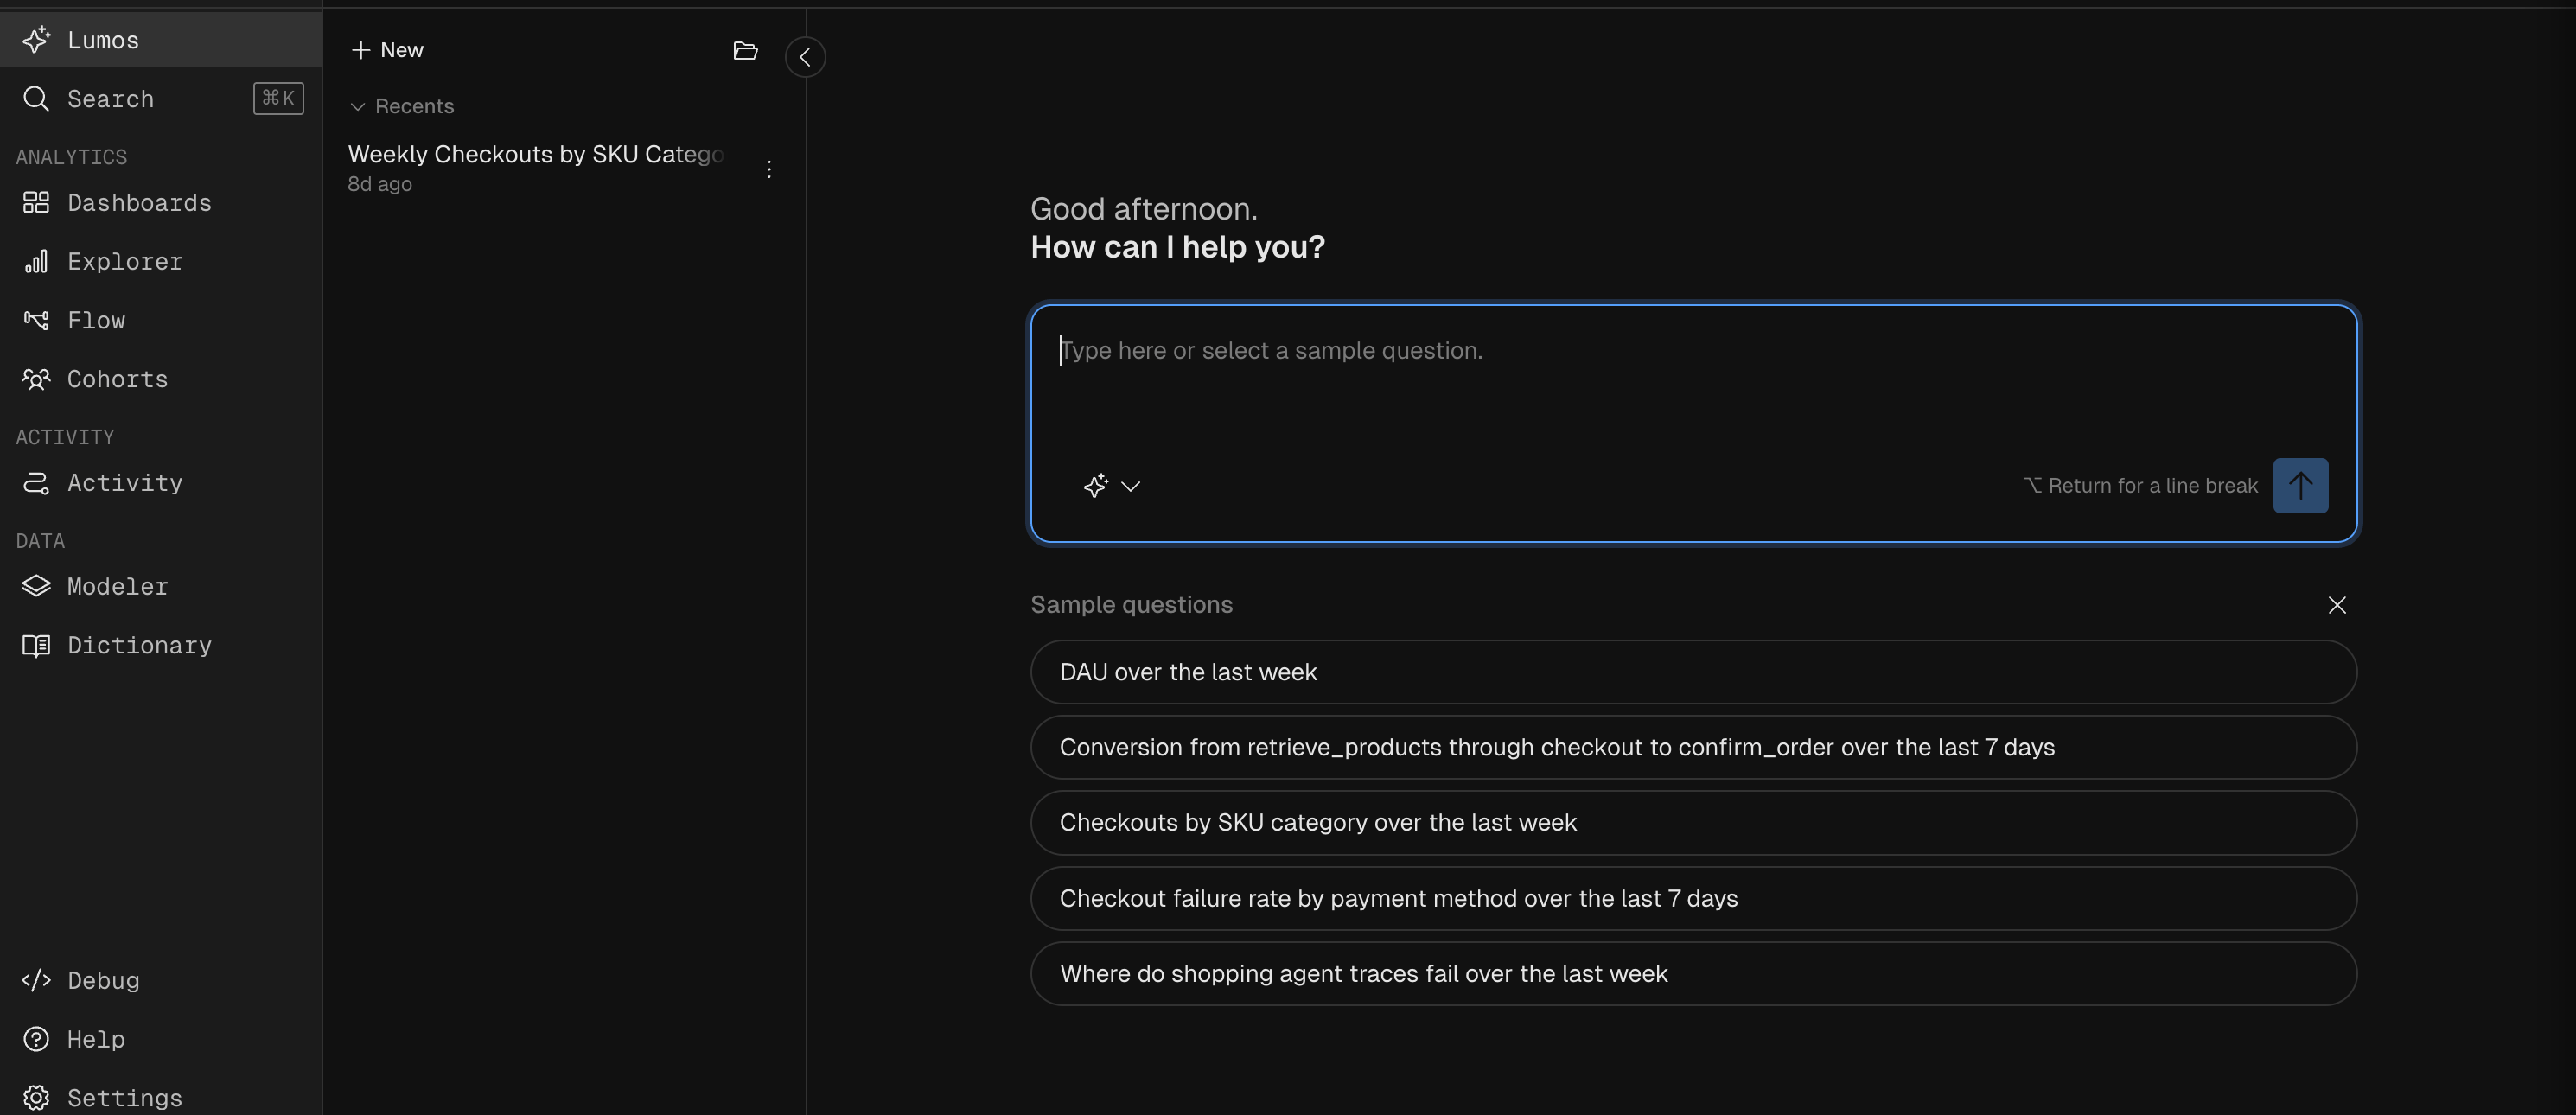
Open Lumos from Lumos at the top of the left nav. Type in the prompt box, or click one of the Sample questions under it. Select the schema Lumos should use if your workspace has more than one. + New at the top of the sessions panel starts a new chat.Ask for reports and cohorts
Lumos builds a report or cohort from a question and shows the result in the chat. Follow-up prompts change the last result, such as adding a group-by or a filter. The answer opens with a summary of the numbers, then Suggested next steps, then a card with the report’s name, date range and interval. Click the card to open the report in the Report pane next to the chat. The prompt box then shows a chip with the report’s name.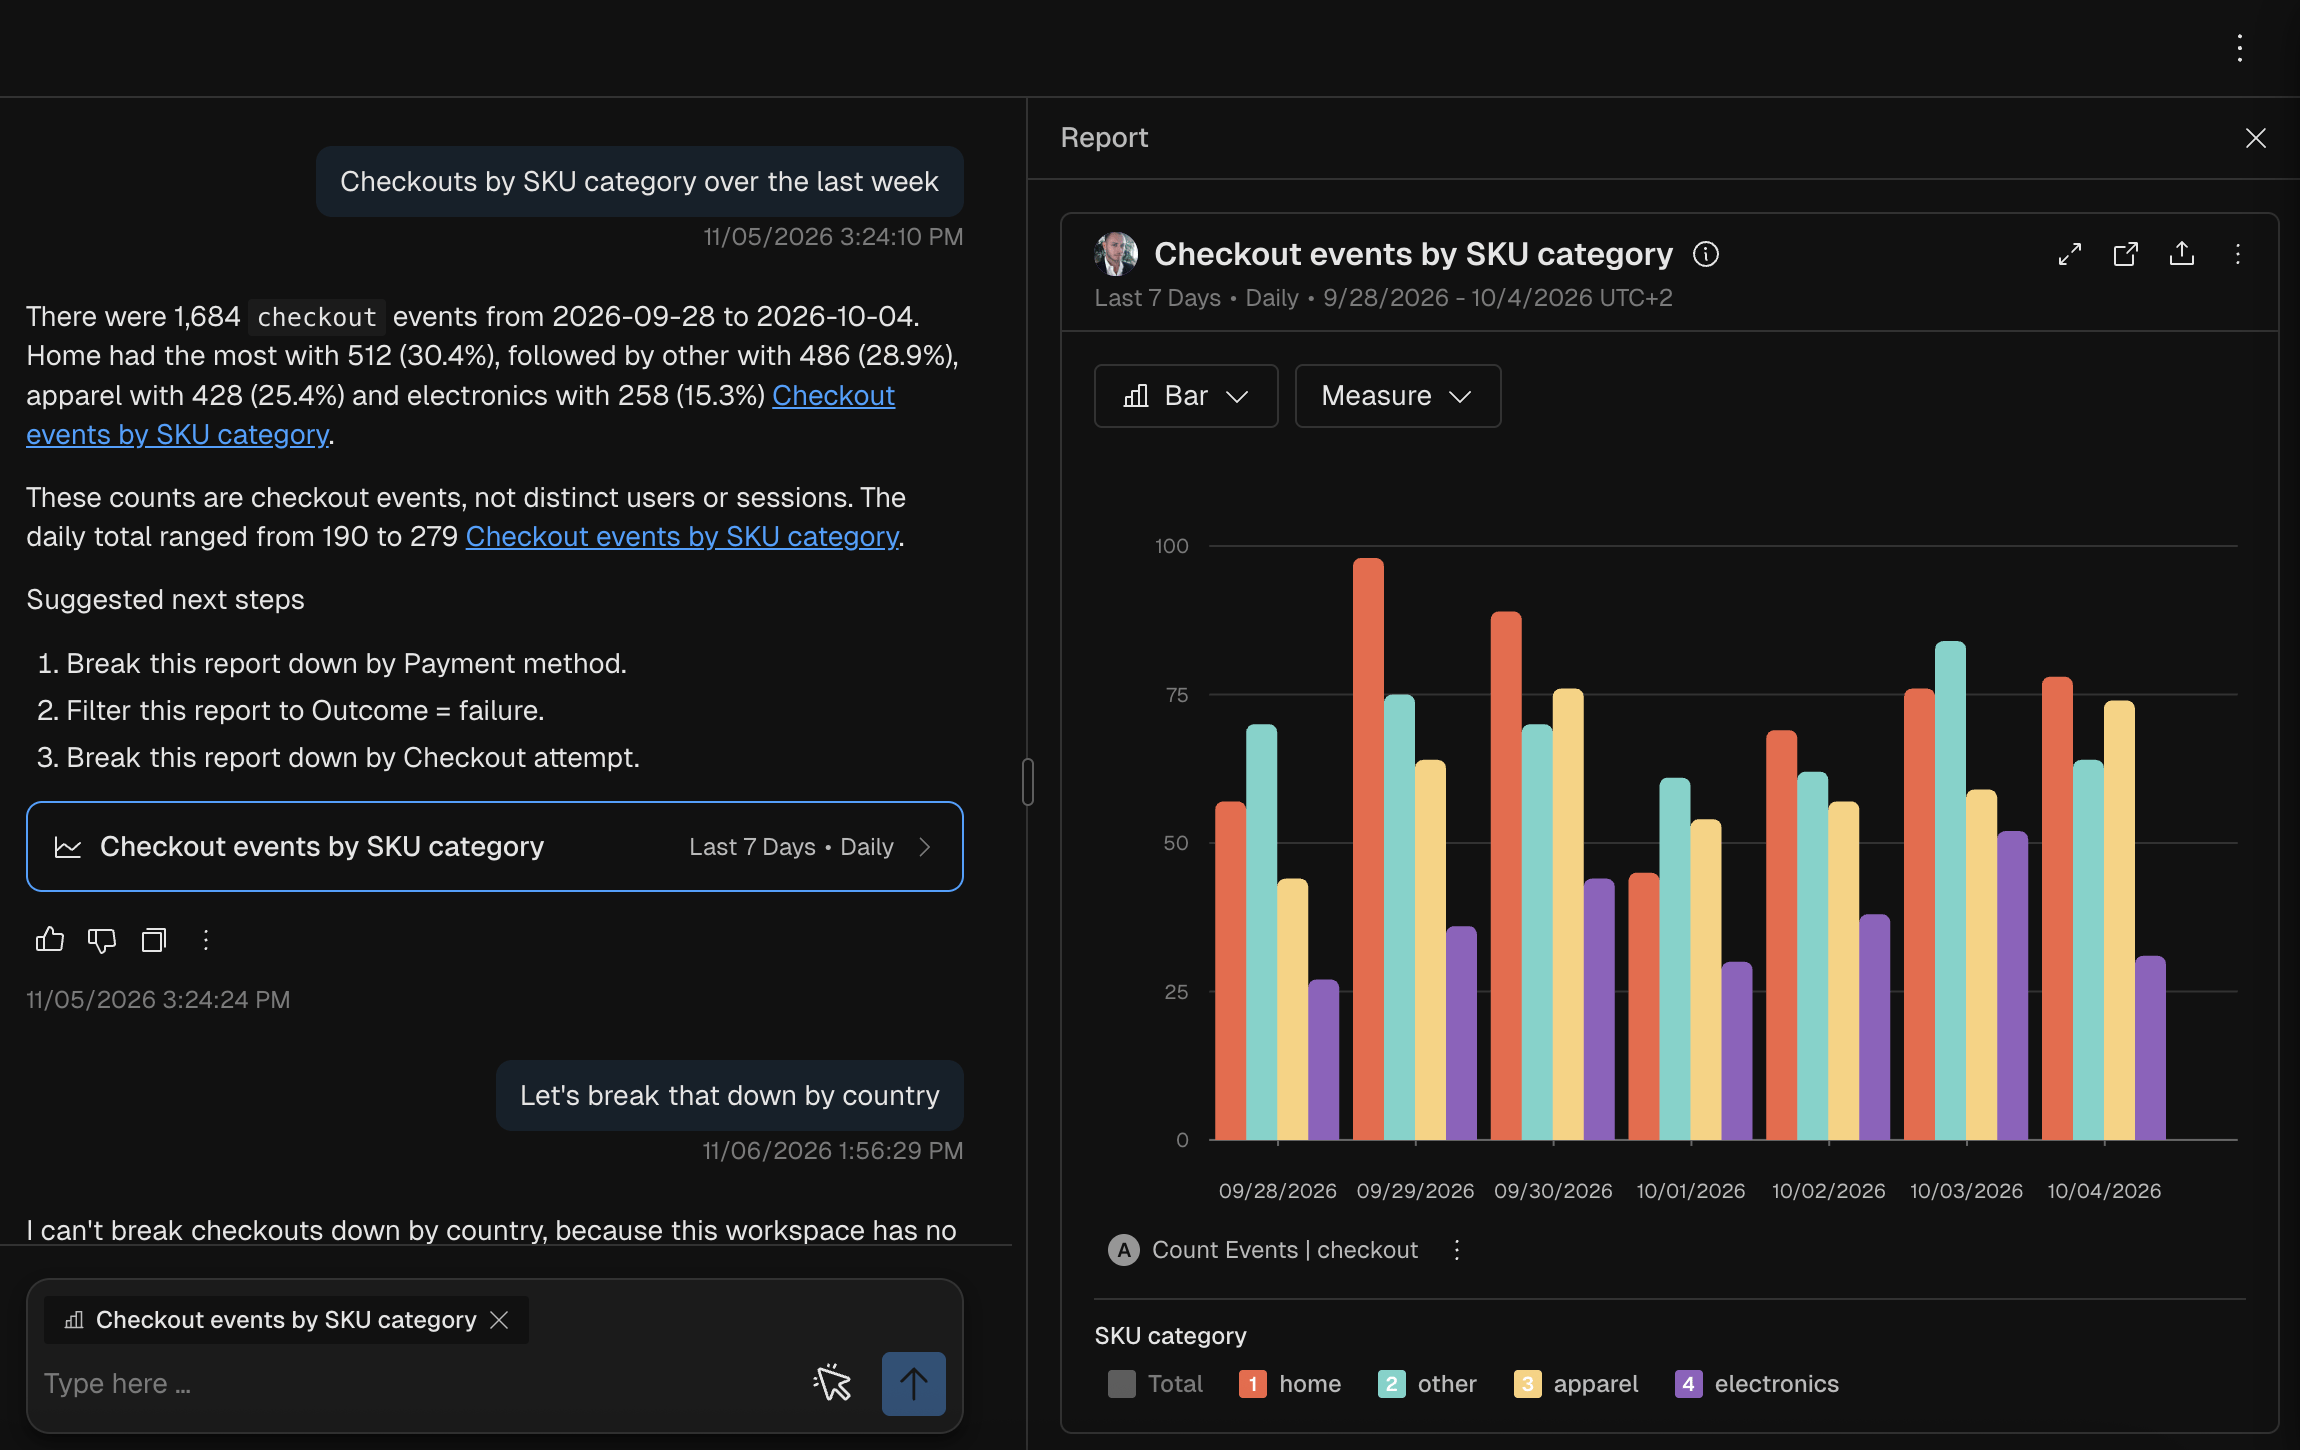
| Action | How |
|---|---|
| Edit it in the builder | Click Open in Explorer in the Report pane |
| Add it to a dashboard | Open it in Explorer, then Share report > Add to Dashboard |
| Export it | Share report (the upload icon) in the Report pane: Export as CSV, Upload to Google Drive or Open in Jupyter |
| Ask about one part of it | Click Point to ask in the prompt box, then click anything in the report |
Example Prompts
“Show me daily active users by platform for the past 2 weeks”
“Where do shopping agent traces fail over the last week?”
“How many users abandoned onboarding after talking to the agent last week, compared to the week before? Break that down by primary intent.”
How Lumos answers
Lumos answers each question in one run. It doesn’t hand the question to a separate agent by topic. Lumos picks tools from the table below, calls as many as the question needs within the limits further down, and writes the answer from what they return. While the run works, the chat lists each step it takes. Click Stop to end a run early.What Lumos can do
Lumos runs Investigate a failure and Open traces at a node only when you ask for them. Otherwise it suggests them.
Availability: Read your code and Use connected apps need a GitHub or MCP connection on the workspace Integrations settings page. Without one, Lumos answers from your Kubit data only.
Limits
Example Prompts
“Why did the support agent’s Exception rate go up last week? Check the code in our repo.”
“Find the report I built yesterday on tool call latency and break it down by model version”
“Investigate the failures at the search_docs node of the Agent flow report”
Anomalies
Kubit checks a report for anomalies every time a Query report, or a Funnel report in Conversion mode, runs. It marks them on time series charts, with or without a group-by. When a report in the chat has anomalies, Lumos receives them with the report and explains them in its answer. There are three kinds:| Kind | Means |
|---|---|
| Volume | Record counts outside the normal range |
| Distribution | Values that don’t match historical patterns |
| Freshness | Data that’s missing or late |
Answer Details
A Lumos answer opens with a summary. When the run collected evidence, such as the files it read or the numbers behind a finding, the evidence goes in a details section under the summary, collapsed. Click Show details to open it and Hide details to close it. An answer with a single fact has no details section. Lumos reads the details of its earlier answers in the chat, so a follow-up such as “where did you see that?” gets an answer from the evidence.Chat Sessions and Timeline
Kubit saves each chat as a session in the sessions panel, under Recents, and names it from its first question. A session’s menu (the three-dot icon) has Open, Copy Link, Fork, Pin, Move to, Mark as unread, Archive, Rename and Delete. A forked session shows a fork icon next to its name. The folder icon at the top of the panel (New section) adds a section that Move to can file sessions into. The arrow next to it (Collapse panel) hides the panel.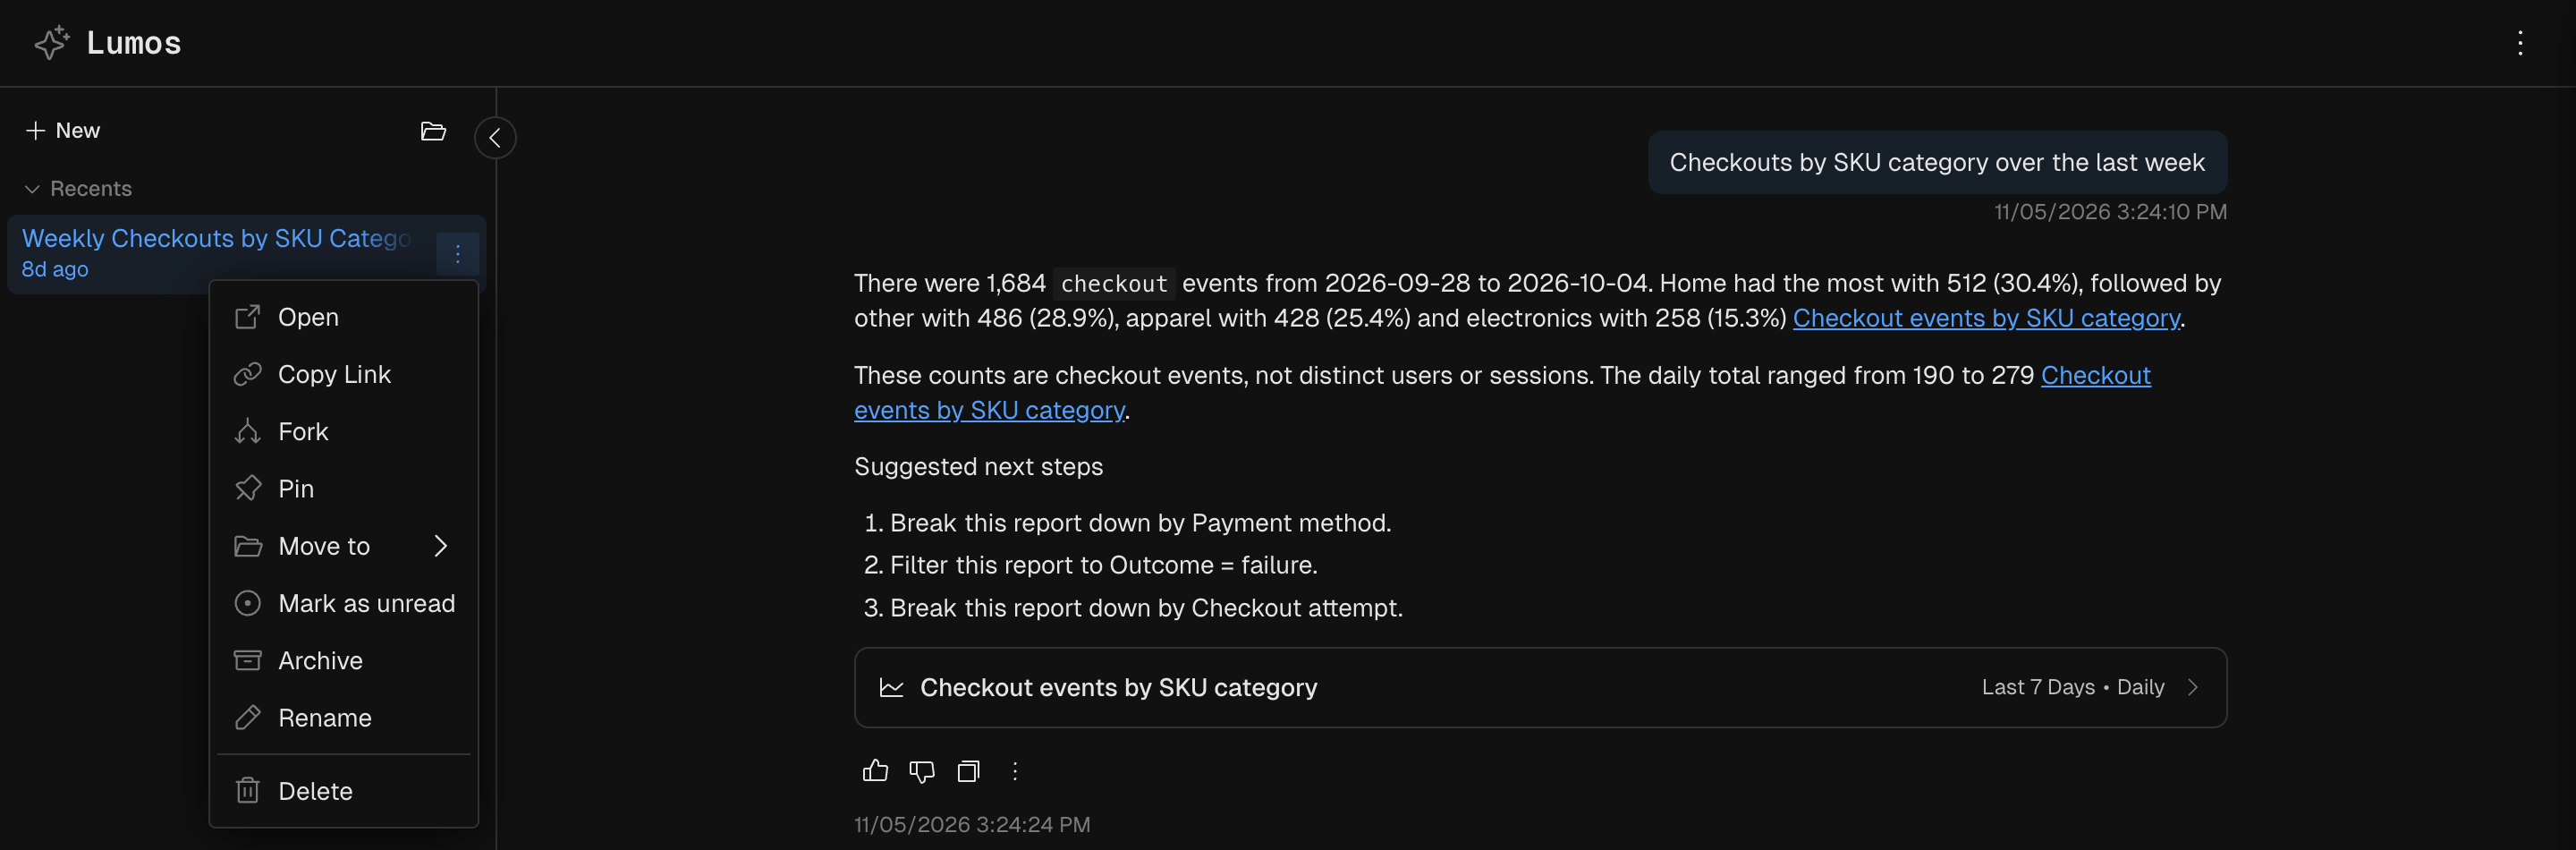
Related
- Reports overview: the report types Lumos builds.
- Dashboards: save what you find.
- Find Missteps that return OK: prompts for finding where your agent goes wrong.
- Agent plugin: ask the same questions from Claude Code or Cursor through the Kubit MCP server.