

wrong_tool or malformed_args label. This page shows how to find those traces in Activity or from an AI assistant. It takes about 5 minutes once your traces are labeled.
Before you start
- A workspace with agent traces. See the Quickstart.
- Traces labeled by Polaris. In Activity, the Labels column reads
Not analysed yetuntil a trace is labeled.
Steps
Read the Labels column
The Labels column shows each trace’s labels. Look for Misstep labels such as 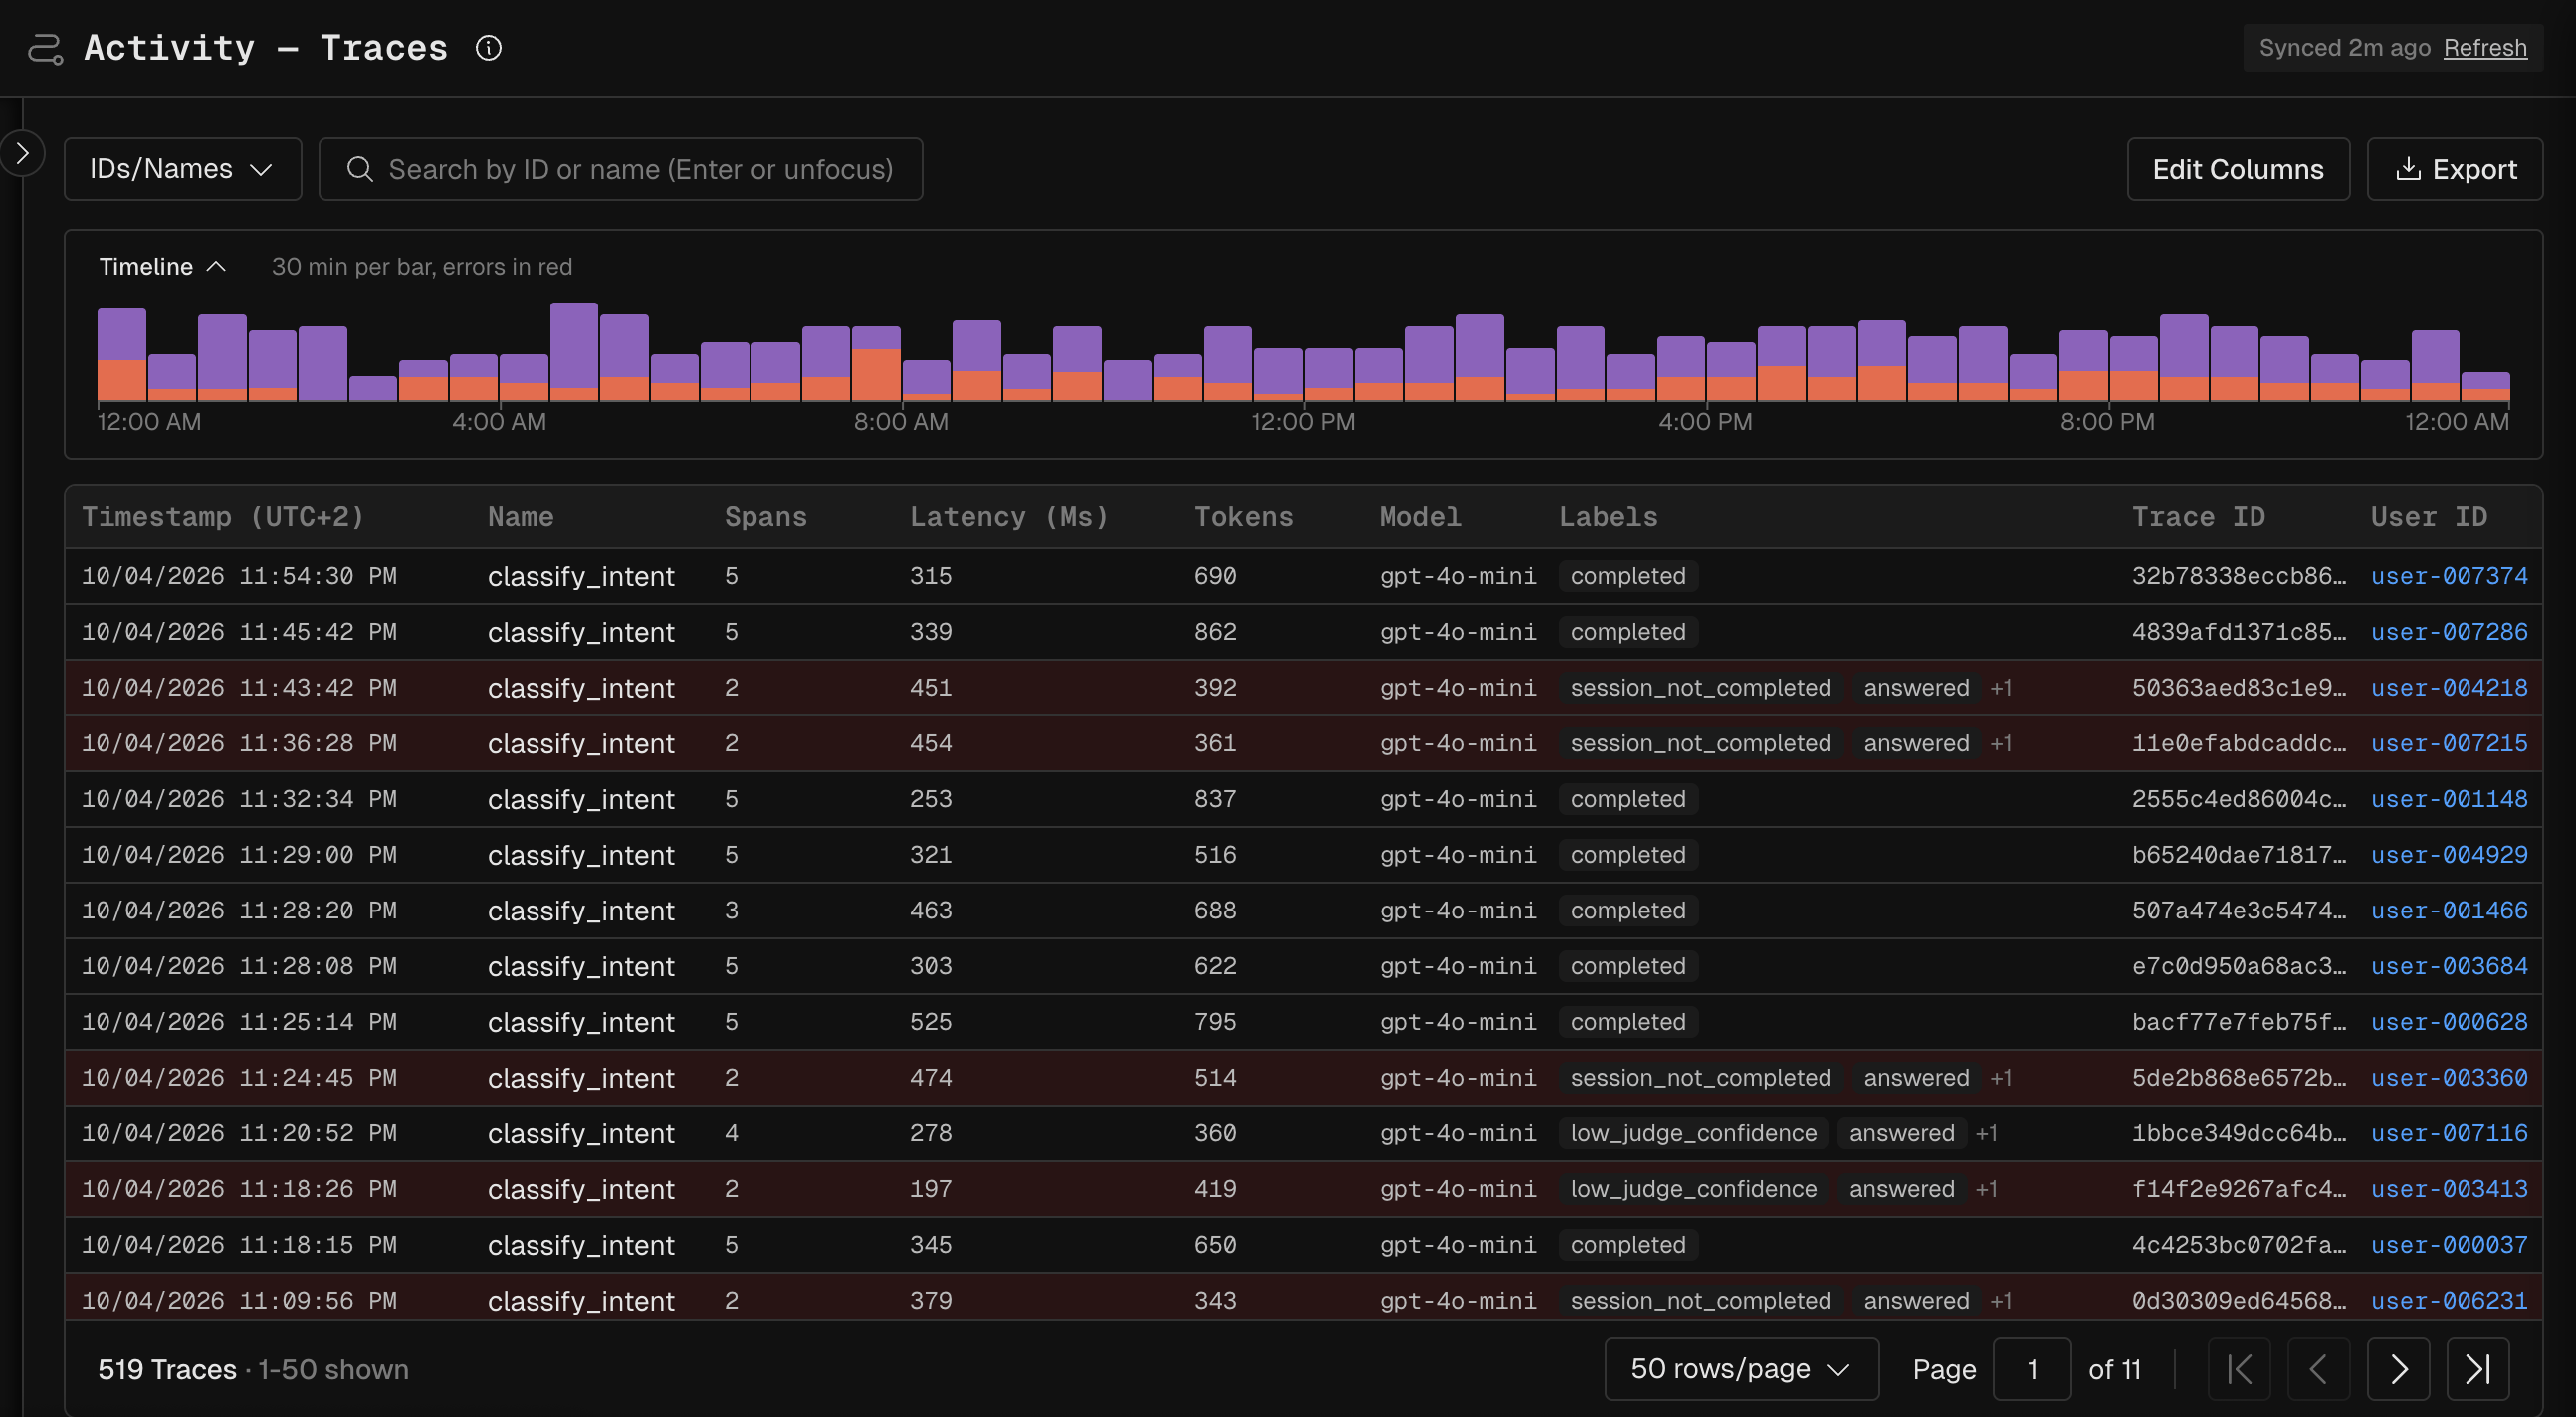
wrong_tool, malformed_args or session_not_completed on traces whose status is OK. Warning labels such as repeated_tool_call are worth a look too.wrong_tool. Trace Misstep Label matches the trace’s label rather than a span’s.Open a trace
Click a trace to open it. The Timeline shows its agent runs, model calls and tool calls. Click a span to see its Model, token counts and Input and Output messages, and check what the agent called and with which arguments.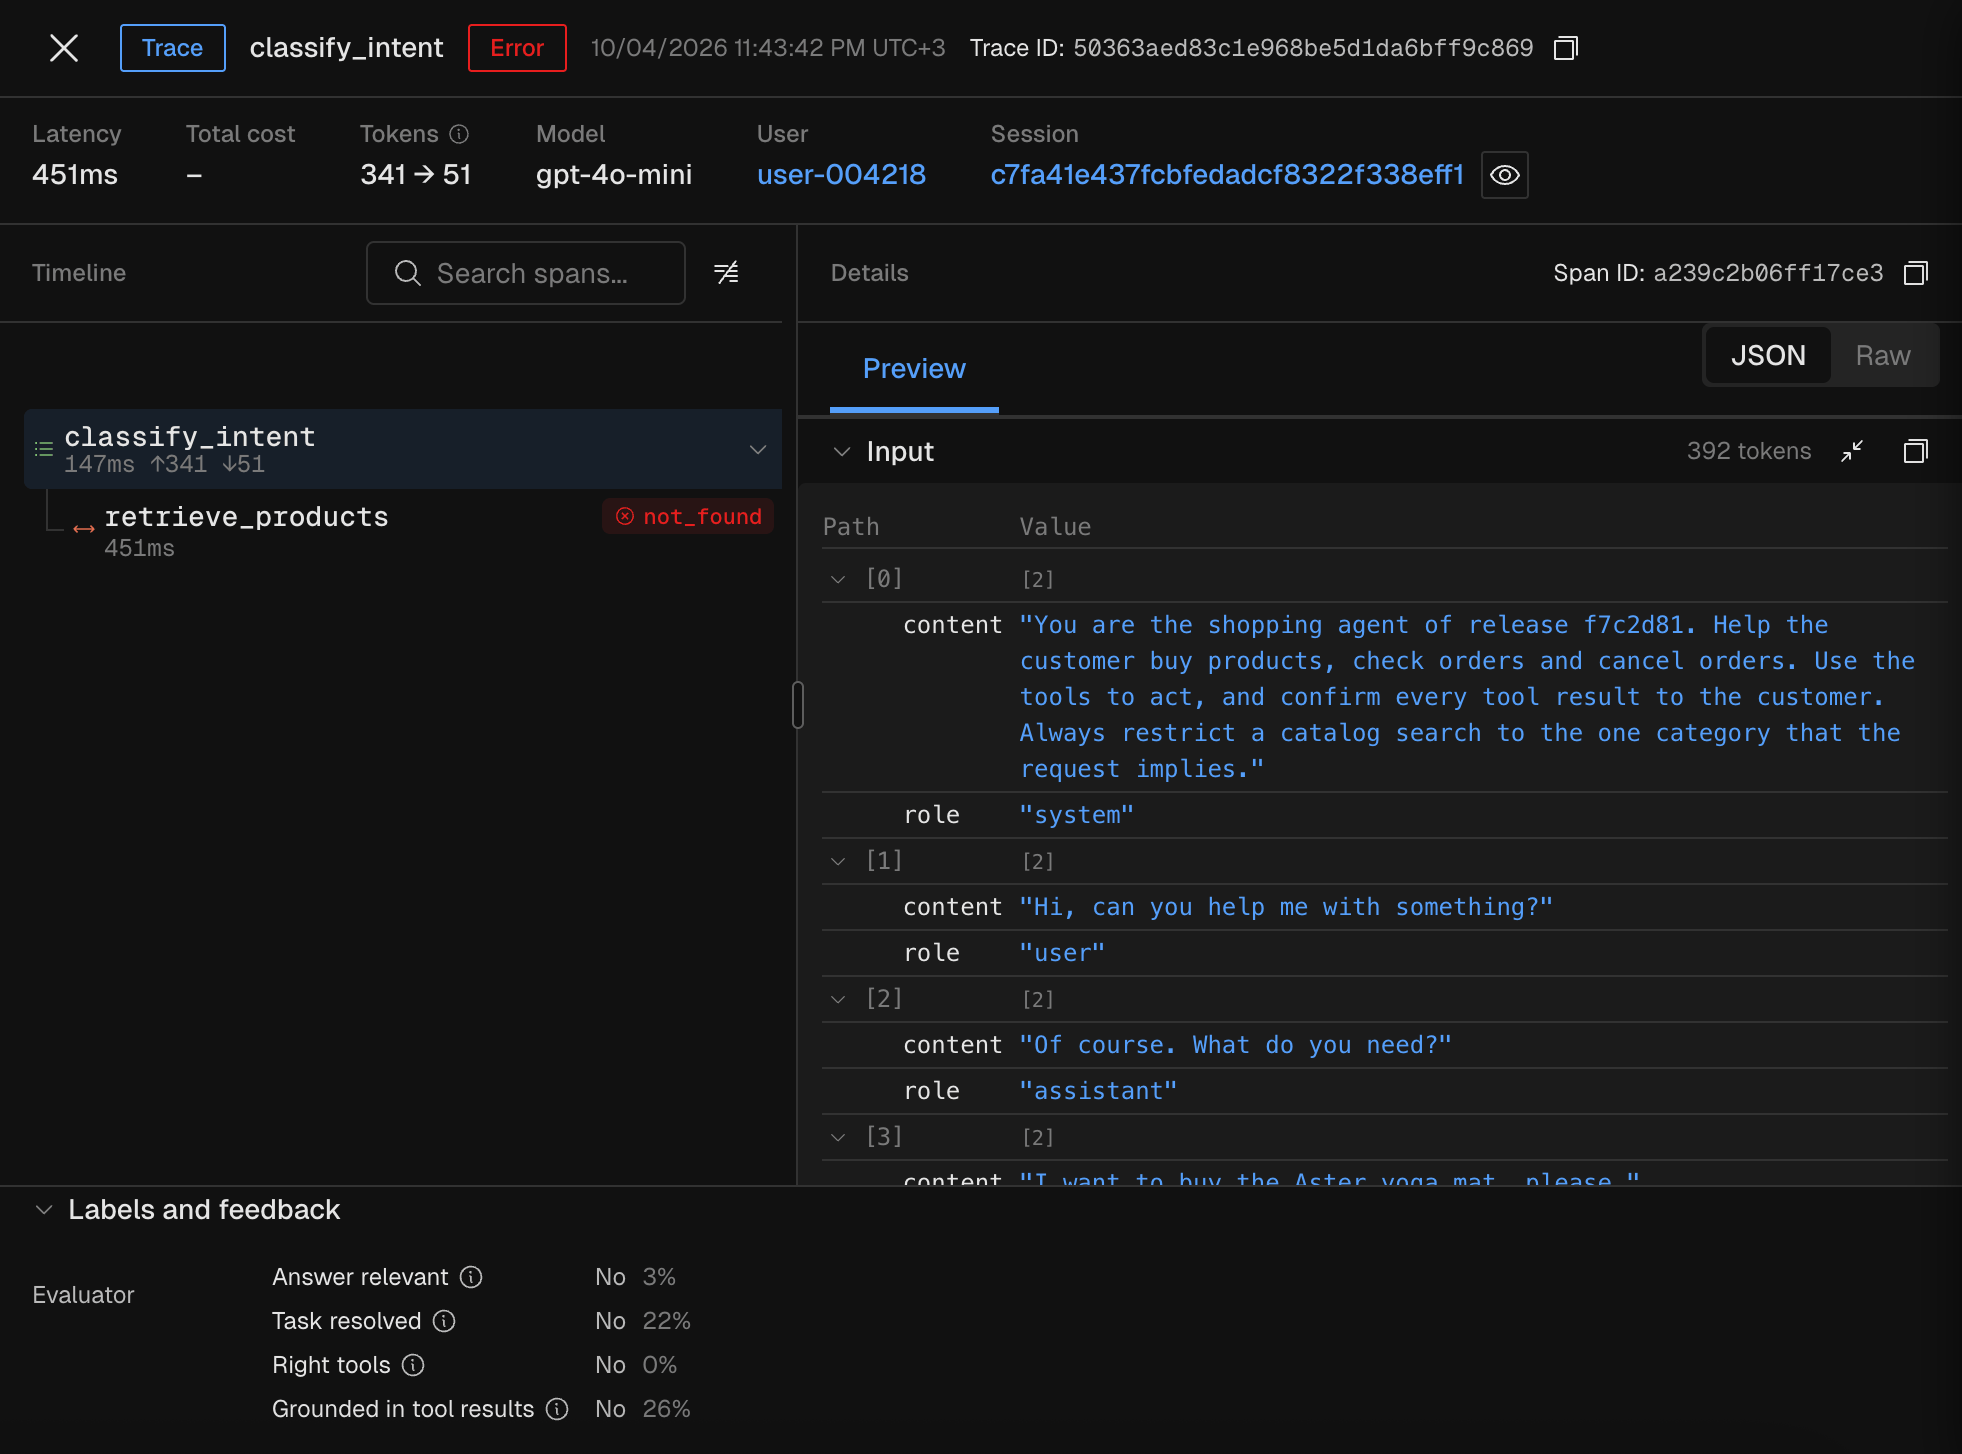
not_found.See how often it happens
Open Flows to see whether the Misstep is one trace or a path many traces take. Each path shows how many traces took it.
Build with a prompt
Ask Lumos or an AI assistant with the Kubit MCP server connected. The/kubit-inspect skill returns the total number of matches, up to 5 sample rows and a CSV export of every match.
“Show me traces from yesterday with a Misstep label”
“Which tool calls had a Misstep label in the last 7 days, grouped by model version?”
Verify
The traces you found have an OK status and at least one Misstep label. Open one and confirm the labeled span called the wrong tool or passed the wrong parameter.If it fails
Next Steps
- Polaris: the classifier and the five annotation types.
- Find what changed before a pattern started: find the commit behind a rise in Missteps.